 5
5peptides
spectra
0.000 | 0.000
0.436 | 0.550
0.000 | 0.000
0.035 | 0.204
0.030 | 0.260
0.133 | 0.303
0.000 | 0.000
0.000 | 0.000
| Plot | Mito | Lyso | Perox | ER | Golgi | PM | Cytosol | Nucleus | |||||
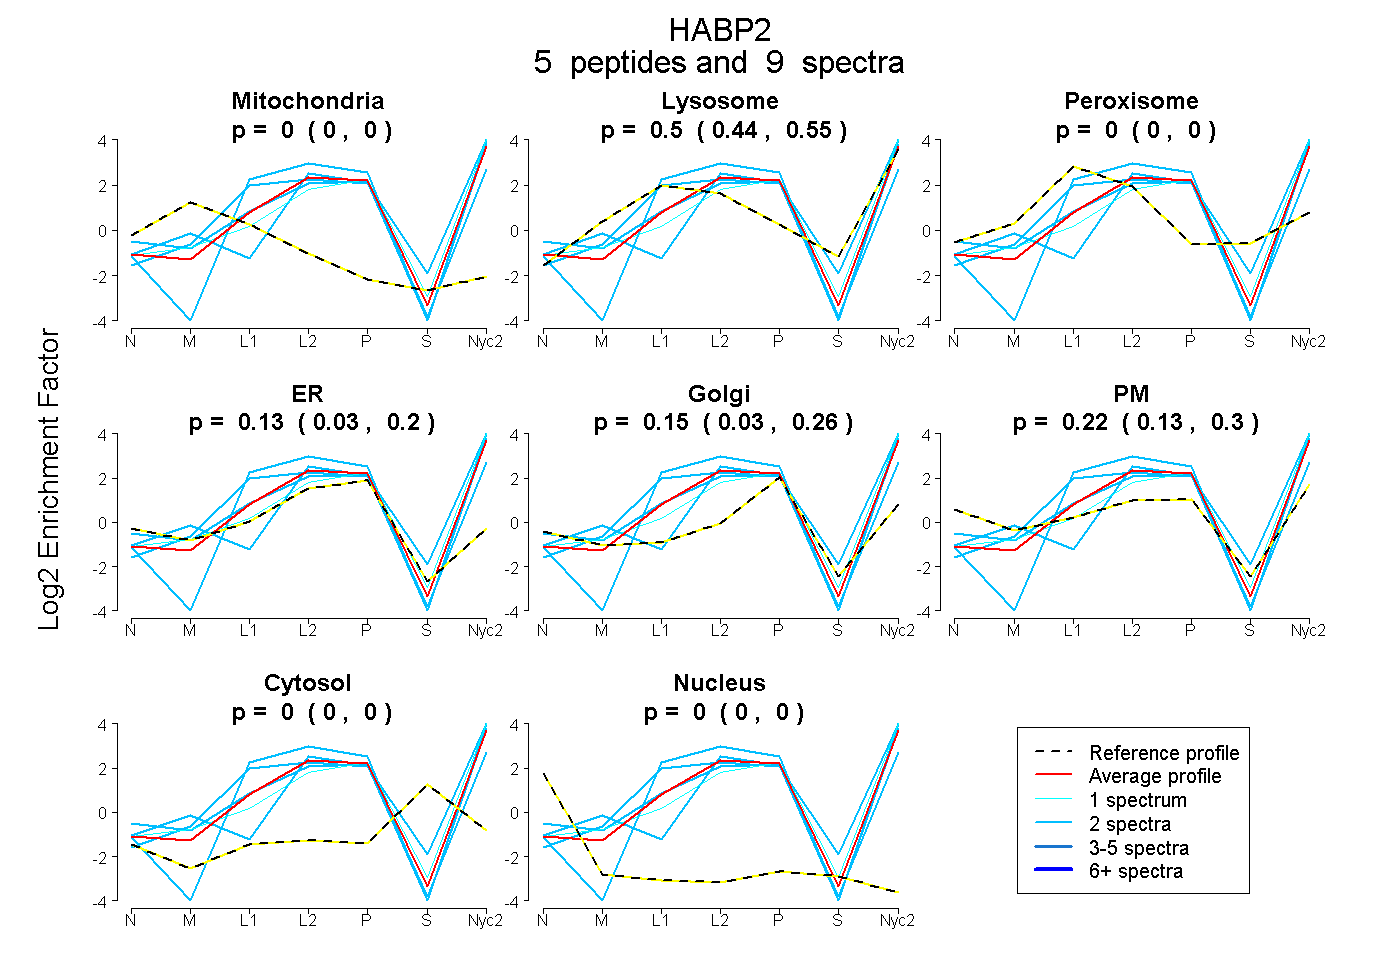
| Expt A |
5 peptides |
9 spectra |
|
0.000 0.000 | 0.000 |
0.501 0.436 | 0.550 |
0.000 0.000 | 0.000 |
0.127 0.035 | 0.204 |
0.150 0.030 | 0.260 |
0.223 0.133 | 0.303 |
0.000 0.000 | 0.000 |
0.000 0.000 | 0.000 |
| 1 spectrum, YPYTGPDCSK | 0.000 | 0.534 | 0.000 | 0.000 | 0.372 | 0.094 | 0.000 | 0.000 | ||
| 2 spectra, VLPVCRPNPCQNGGVCSR | 0.000 | 0.533 | 0.000 | 0.467 | 0.000 | 0.000 | 0.000 | 0.000 | ||
| 2 spectra, CQTVQNK | 0.000 | 0.863 | 0.000 | 0.116 | 0.021 | 0.000 | 0.000 | 0.000 | ||
| 2 spectra, FSCACPDQYK | 0.000 | 0.298 | 0.000 | 0.000 | 0.267 | 0.435 | 0.000 | 0.000 | ||
| 2 spectra, LIANALCNSR | 0.000 | 0.268 | 0.000 | 0.287 | 0.000 | 0.445 | 0.000 | 0.000 |
| Plot | Mito | Lyso or Perox | ER | Golgi | PM | Cytosol | Nucleus | ||||||
| Expt B |
2 peptides |
3 spectra |
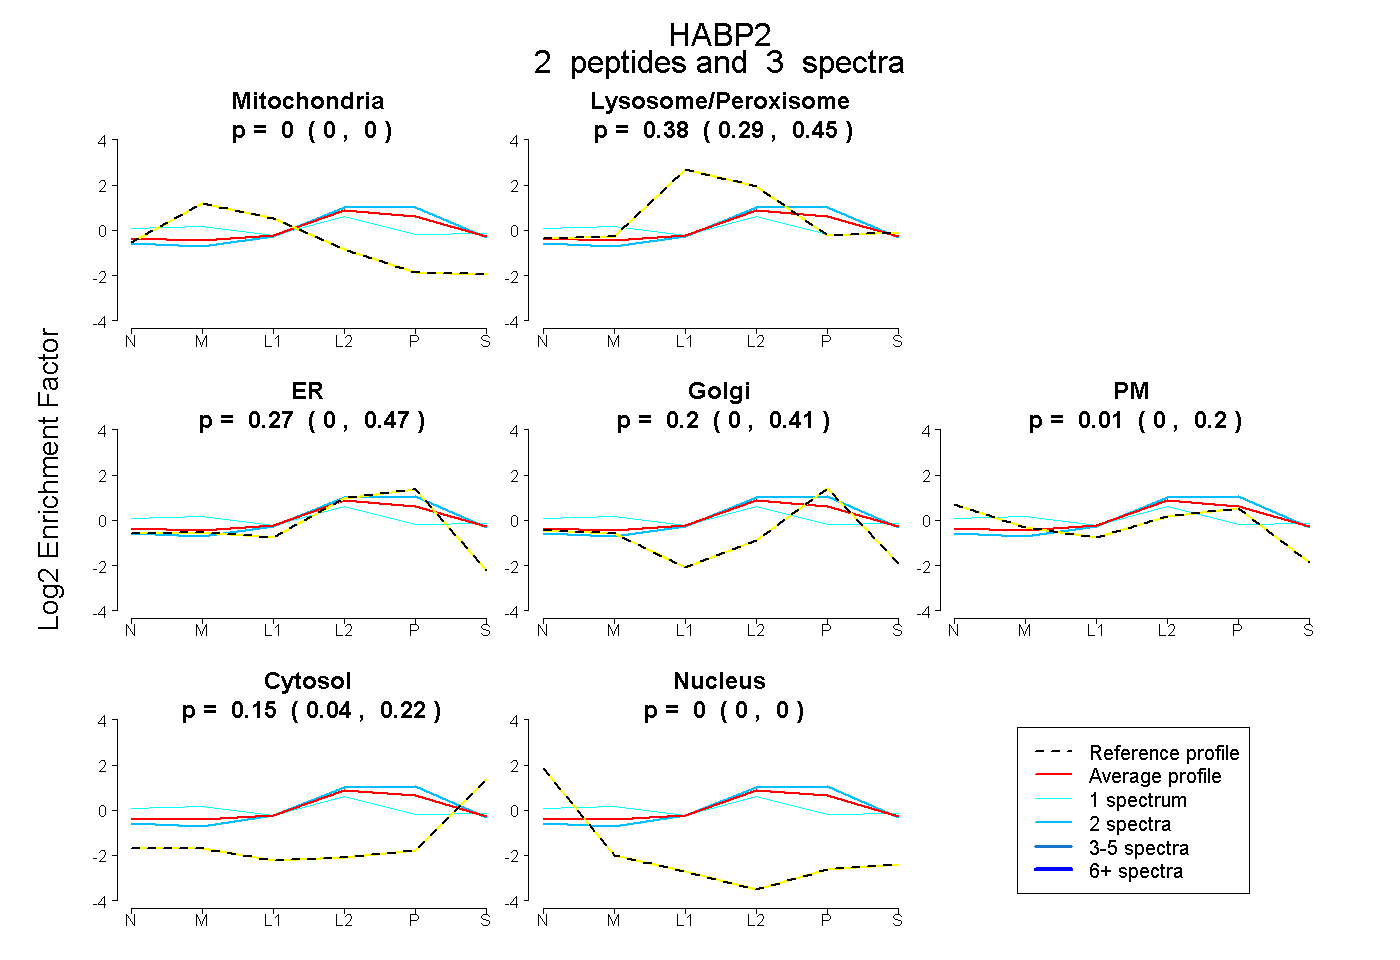 |
0.000 0.000 | 0.000 |
0.380 0.287 | 0.447 |
0.270 0.000 | 0.466 |
0.196 0.000 | 0.415 |
0.009 0.000 | 0.204 |
0.145 0.043 | 0.223 |
0.000 0.000 | 0.000 |
|||
| Plot | Lyso | Other | |||||||||||
| Expt C |
10 peptides |
26 spectra |
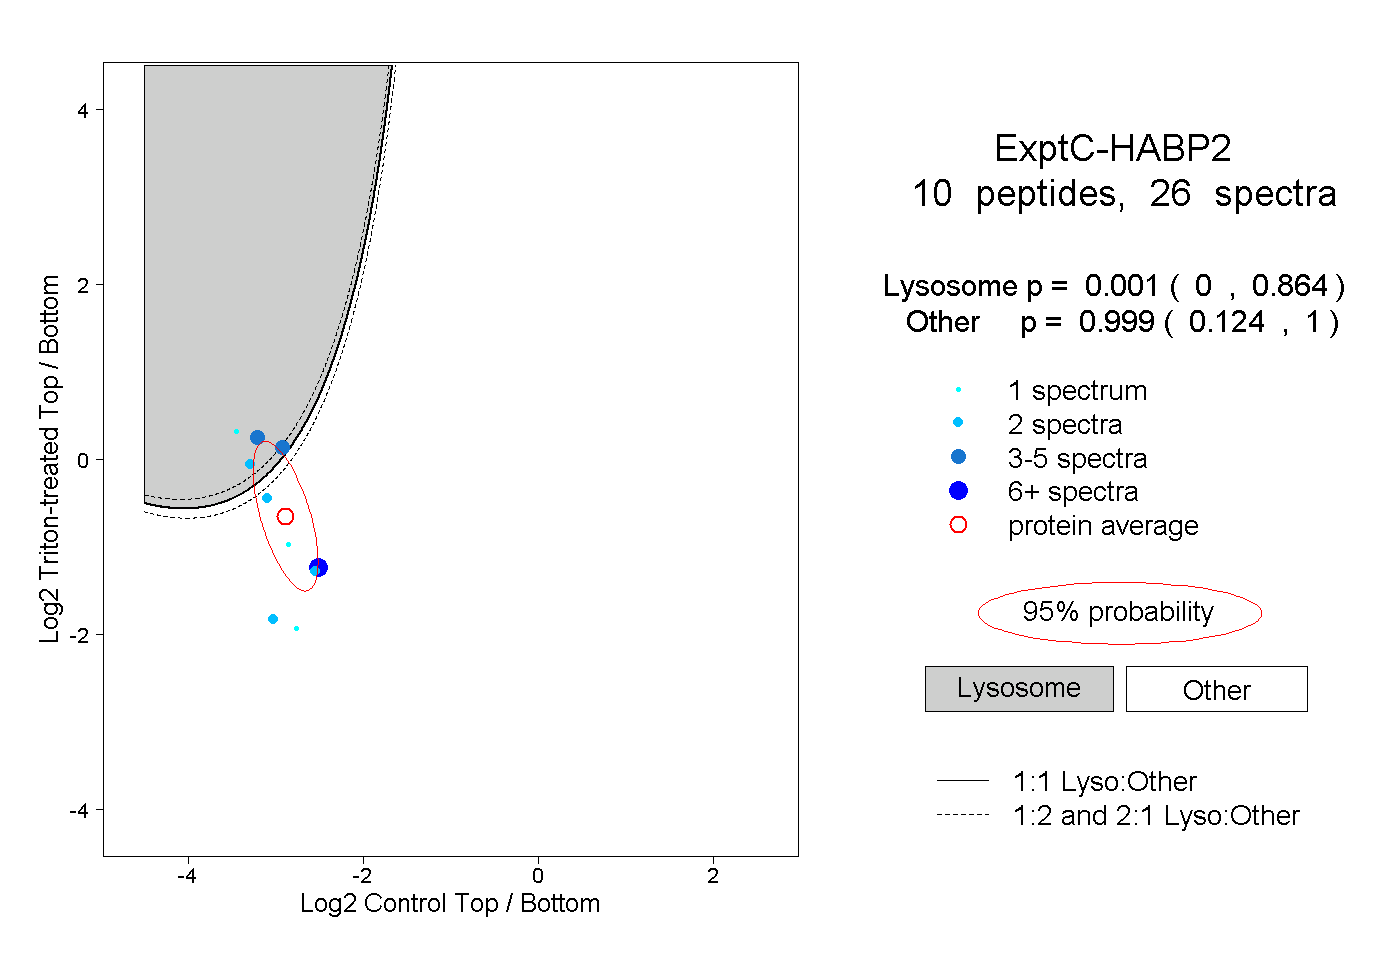 |
0.001 0.000 | 0.864 |
0.999 0.124 | 1.000 |
||||||||
| Plot | Lyso | Other | |||||||||||
| Expt D |
1 peptide |
1 spectrum |
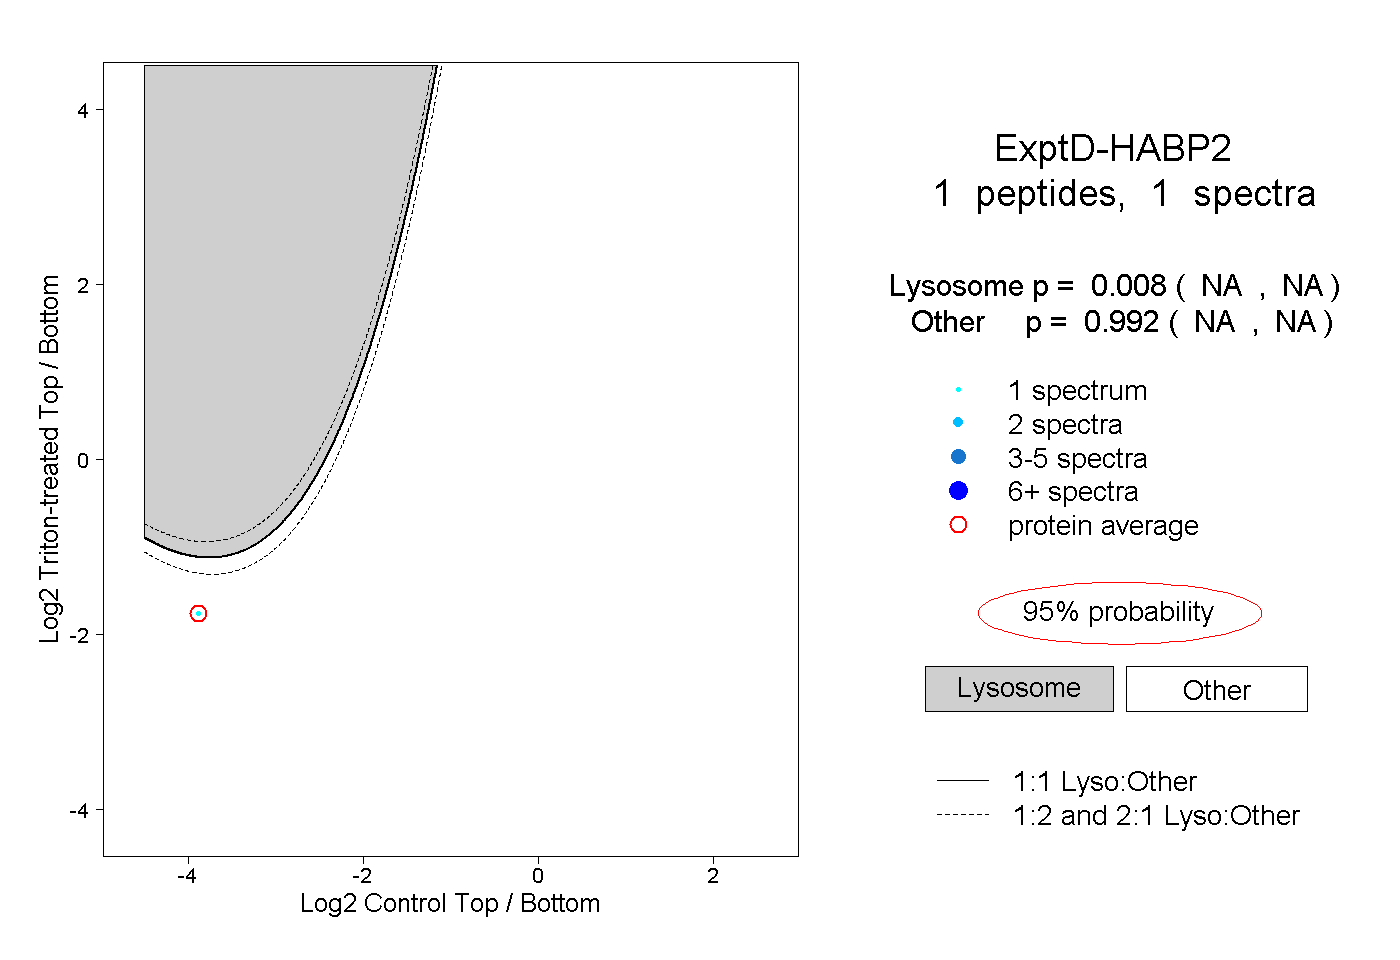 |
0.008 NA | NA |
0.992 NA | NA |