 13
13peptides
spectra

0.000 | 0.000
0.175 | 0.185
0.000 | 0.000
0.000 | 0.000
0.000 | 0.000
0.000 | 0.000
0.815 | 0.824
0.000 | 0.000
11peptides
spectra

0.000 | 0.000
1.000 | 1.000
1peptide
spectra
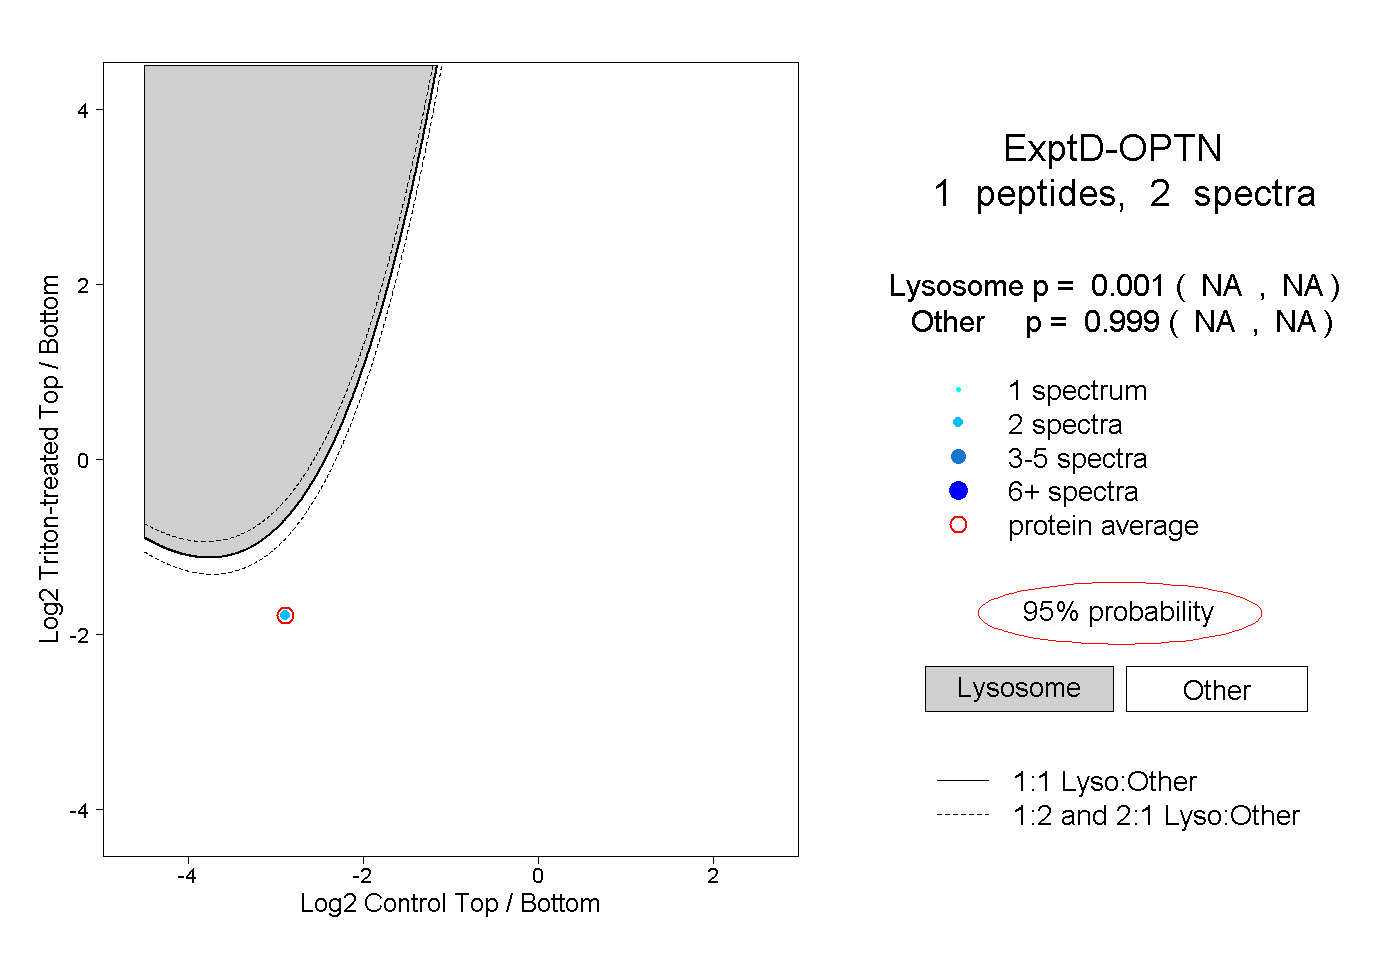
NA | NA
NA | NA