 13
13peptides
spectra

0.000 | 0.000
0.175 | 0.185
0.000 | 0.000
0.000 | 0.000
0.000 | 0.000
0.000 | 0.000
0.815 | 0.824
0.000 | 0.000
11peptides
spectra

0.000 | 0.000
1.000 | 1.000
| Plot | Mito | Lyso | Perox | ER | Golgi | PM | Cytosol | Nucleus | |||||
| Expt A |
13 peptides |
23 spectra |
|
0.000 0.000 | 0.000 |
0.180 0.175 | 0.185 |
0.000 0.000 | 0.000 |
0.000 0.000 | 0.000 |
0.000 0.000 | 0.000 |
0.000 0.000 | 0.000 |
0.820 0.815 | 0.824 |
0.000 0.000 | 0.000 |
||
| Plot | Lyso | Other | |||||||||||
| Expt C |
11 peptides |
23 spectra |
|
0.000 0.000 | 0.000 |
1.000 1.000 | 1.000 |
| 1 spectrum, LSEAELMK | 0.000 | 1.000 | ||||||||
| 2 spectra, LLQEHNK | 0.000 | 1.000 | ||||||||
| 2 spectra, QELVYSNR | 0.000 | 1.000 | ||||||||
| 2 spectra, SERPFEDITGR | 0.000 | 1.000 | ||||||||
| 1 spectrum, AQMEVYCSDFHAER | 0.000 | 1.000 | ||||||||
| 1 spectrum, QEEDLETMAVLR | 0.000 | 1.000 | ||||||||
| 5 spectra, ELQEAHTK | 0.000 | 1.000 | ||||||||
| 1 spectrum, ENNDFEDGGSR | 0.000 | 1.000 | ||||||||
| 2 spectra, LNNQAMK | 0.000 | 1.000 | ||||||||
| 4 spectra, ELLVENHQLK | 0.000 | 1.000 | ||||||||
| 2 spectra, SIPIHSCPK | 0.000 | 1.000 |
| Plot | Lyso | Other | |||||||||||
| Expt D |
1 peptide |
2 spectra |
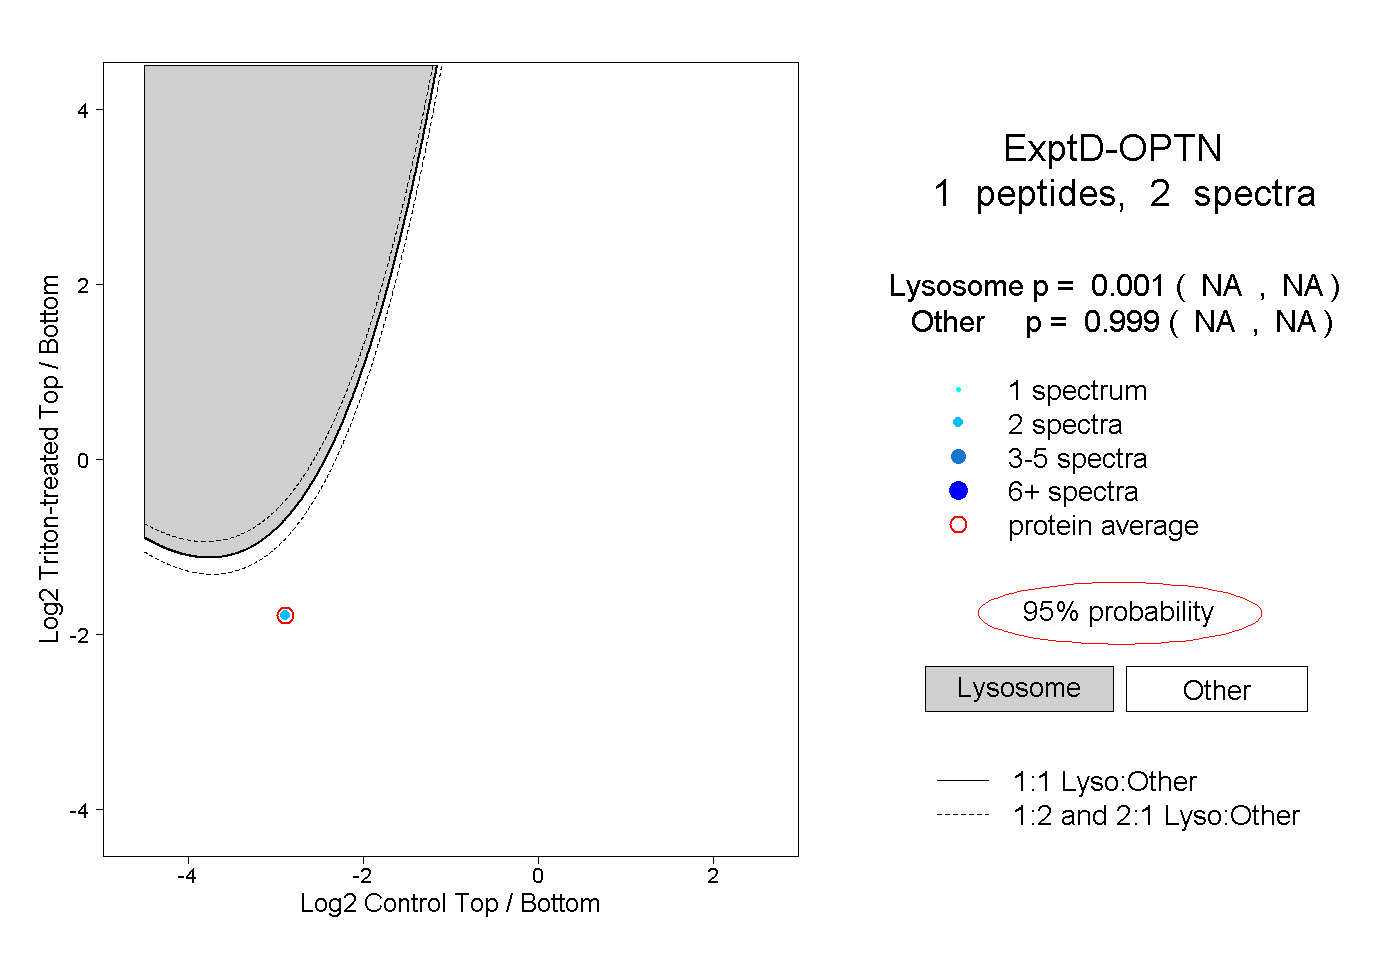 |
0.001 NA | NA |
0.999 NA | NA |