 9
9peptides
spectra
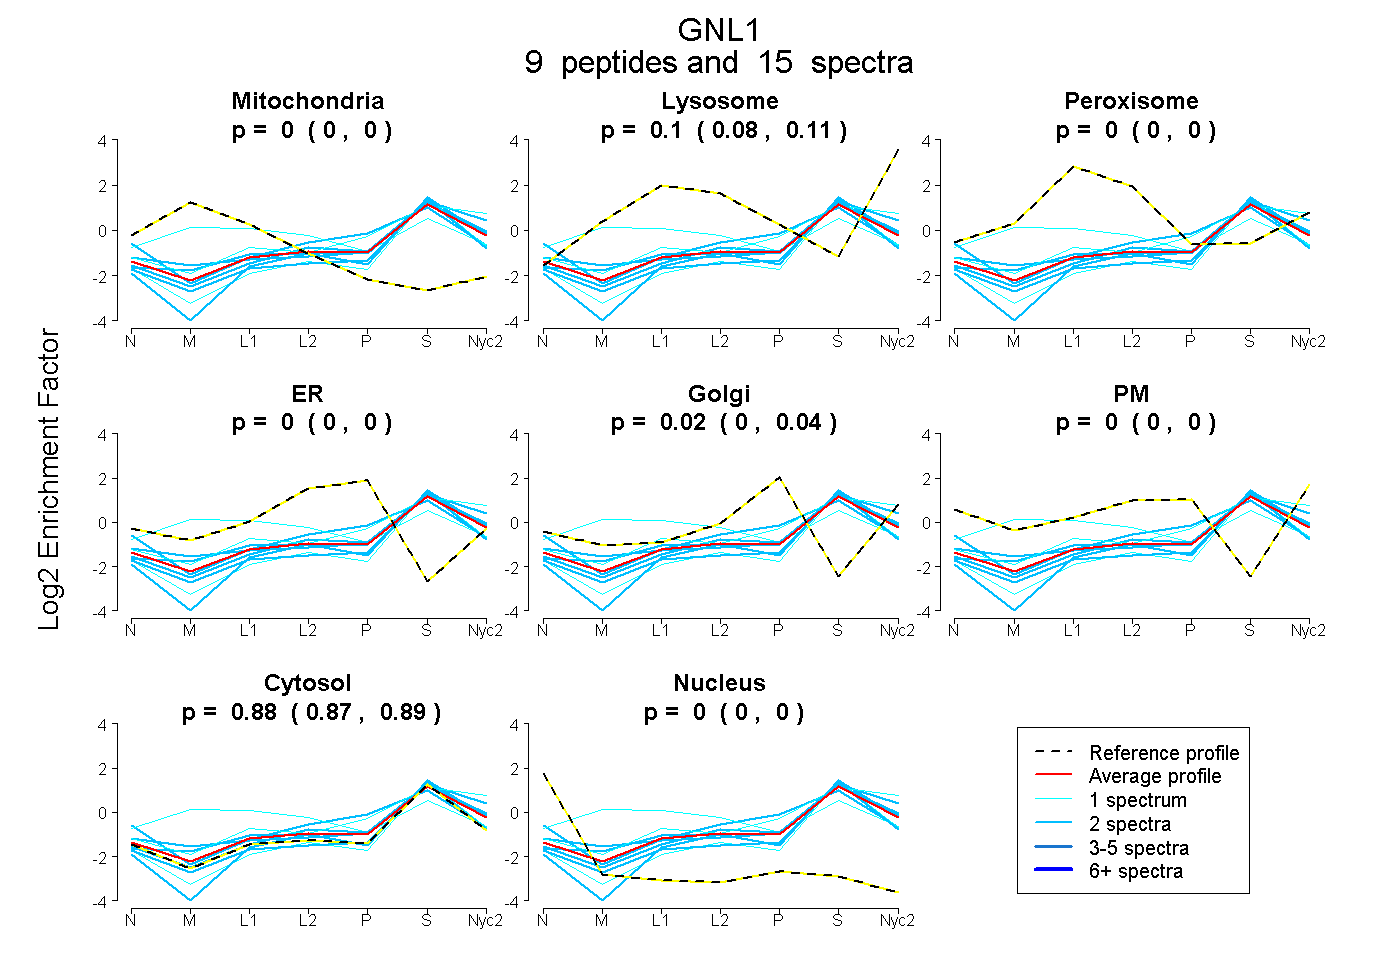
0.000 | 0.000
0.077 | 0.114
0.000 | 0.000
0.000 | 0.000
0.000 | 0.037
0.000 | 0.000
0.866 | 0.894
0.000 | 0.000
4peptides
spectra
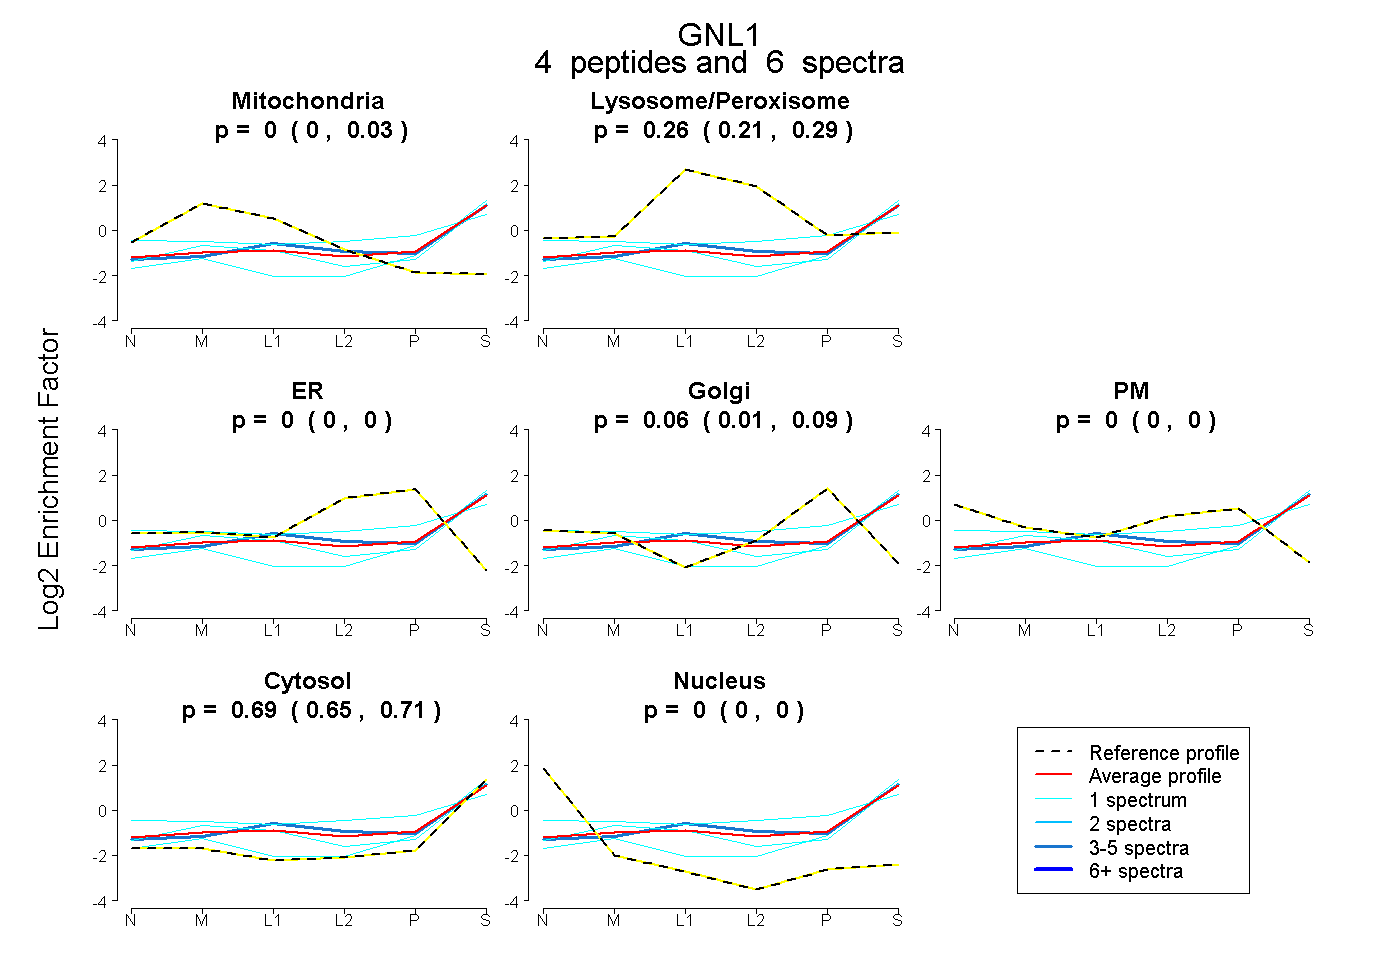
0.000 | 0.033
0.210 | 0.287
0.000 | 0.000
0.015 | 0.089
0.000 | 0.001
0.650 | 0.714
0.000 | 0.000
6peptides
spectra
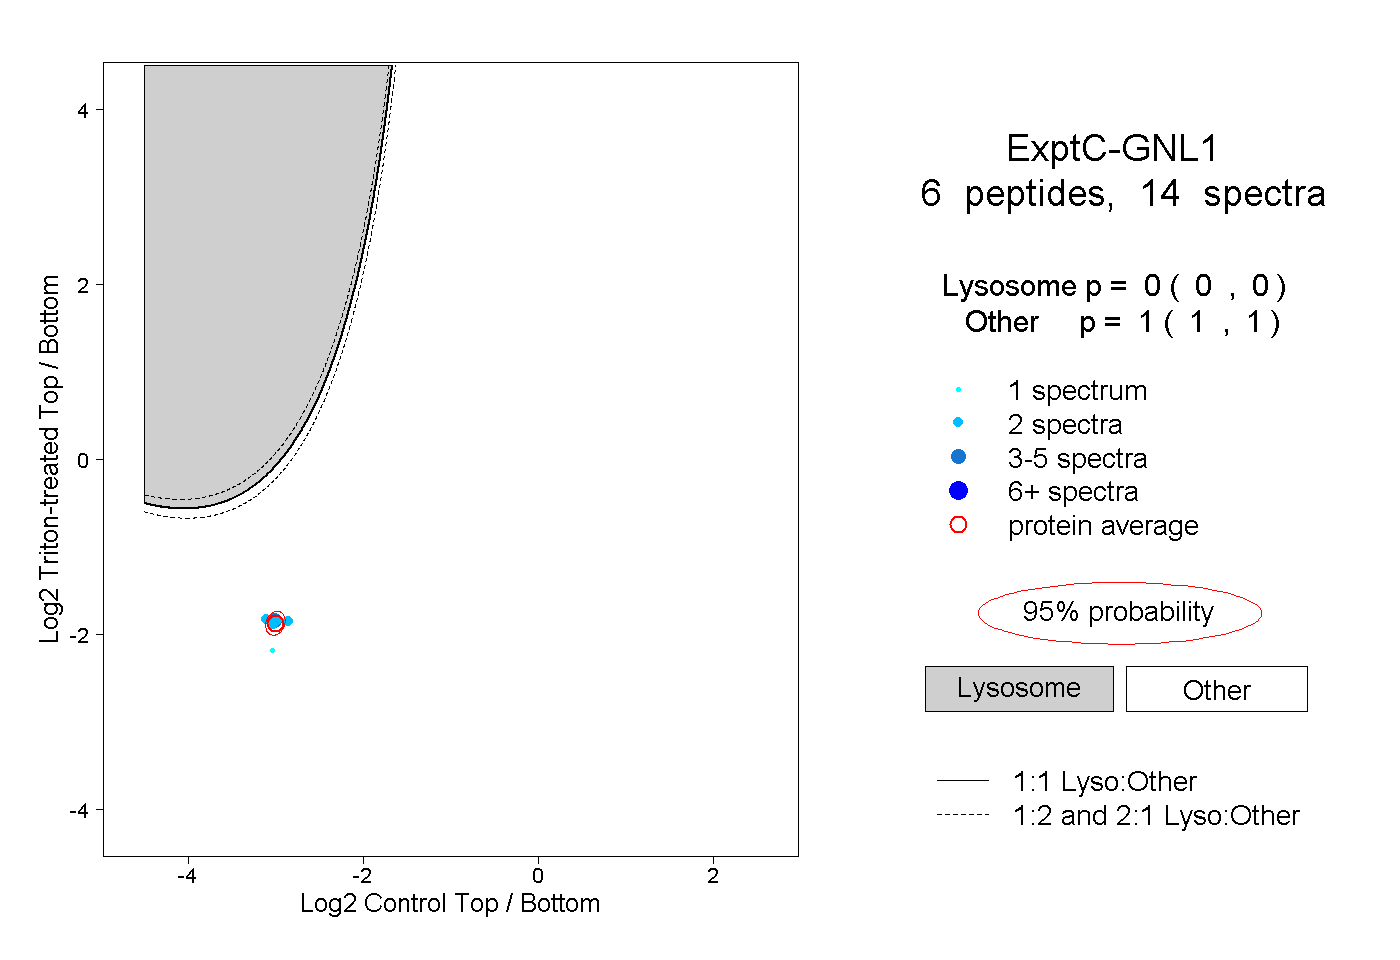
0.000 | 0.000
1.000 | 1.000