GNL1
[ENSRNOP00000045697]
Main page
| | | Plot |
Mito |
Lyso |
|
Perox |
ER |
Golgi |
PM |
Cytosol |
Nucleus |
|
| Expt A |
 9
9
peptides |
15
spectra |
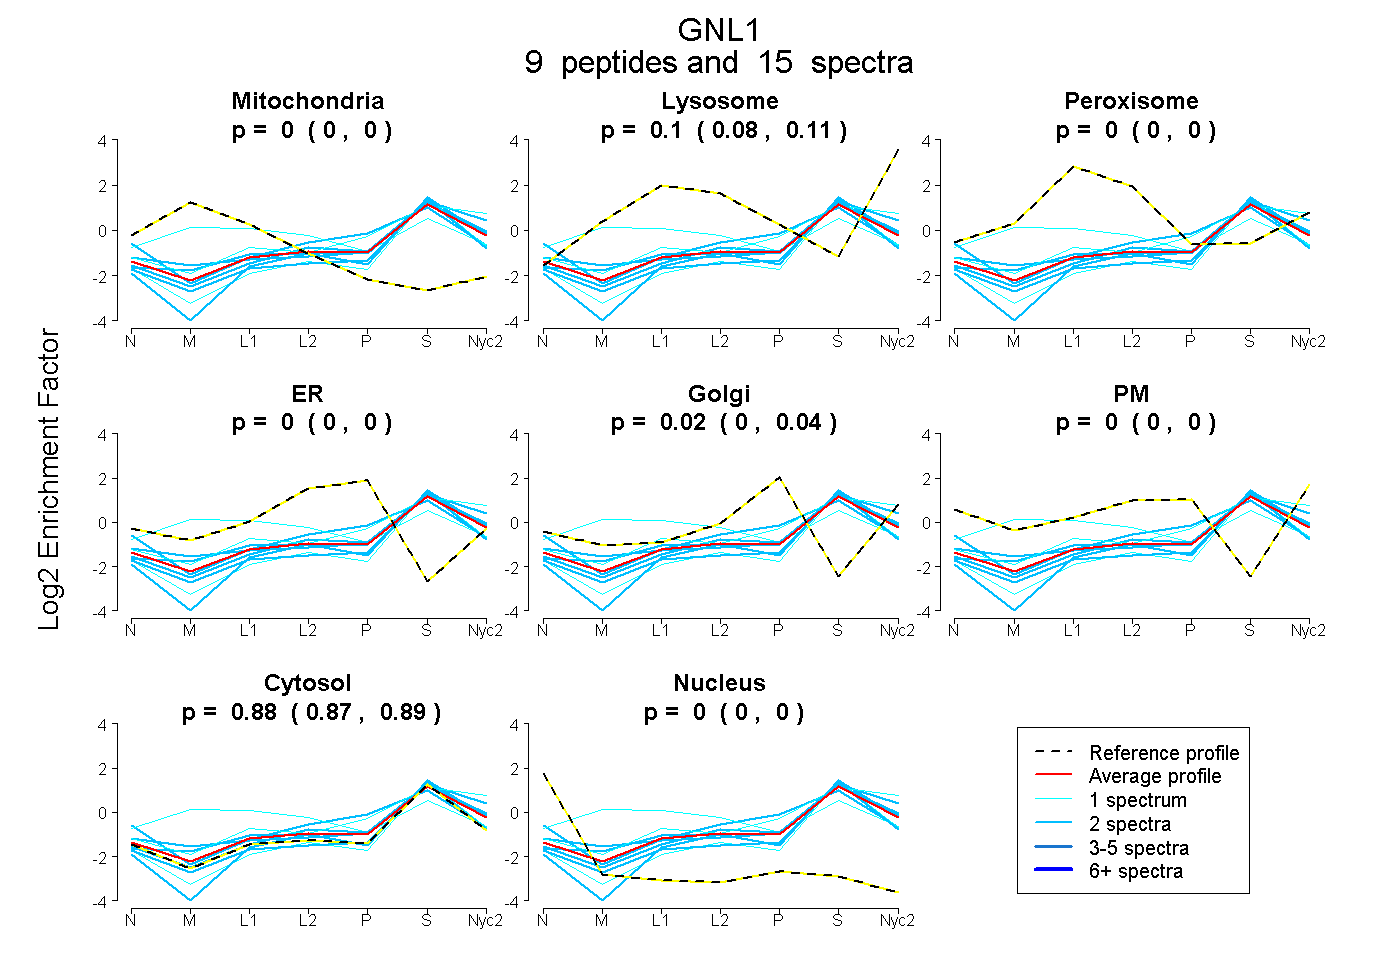 |
0.000
0.000 | 0.000 |
0.097
0.077 | 0.114 |
|
0.000
0.000 | 0.000 |
0.000
0.000 | 0.000 |
0.022
0.000 | 0.037 |
0.000
0.000 | 0.000 |
0.881
0.866 | 0.894 |
0.000
0.000 | 0.000 |
|
| | | Plot |
Mito |
|
Lyso or Perox |
|
ER |
Golgi |
PM |
Cytosol |
Nucleus |
|
| Expt B |
4
peptides |
6
spectra |
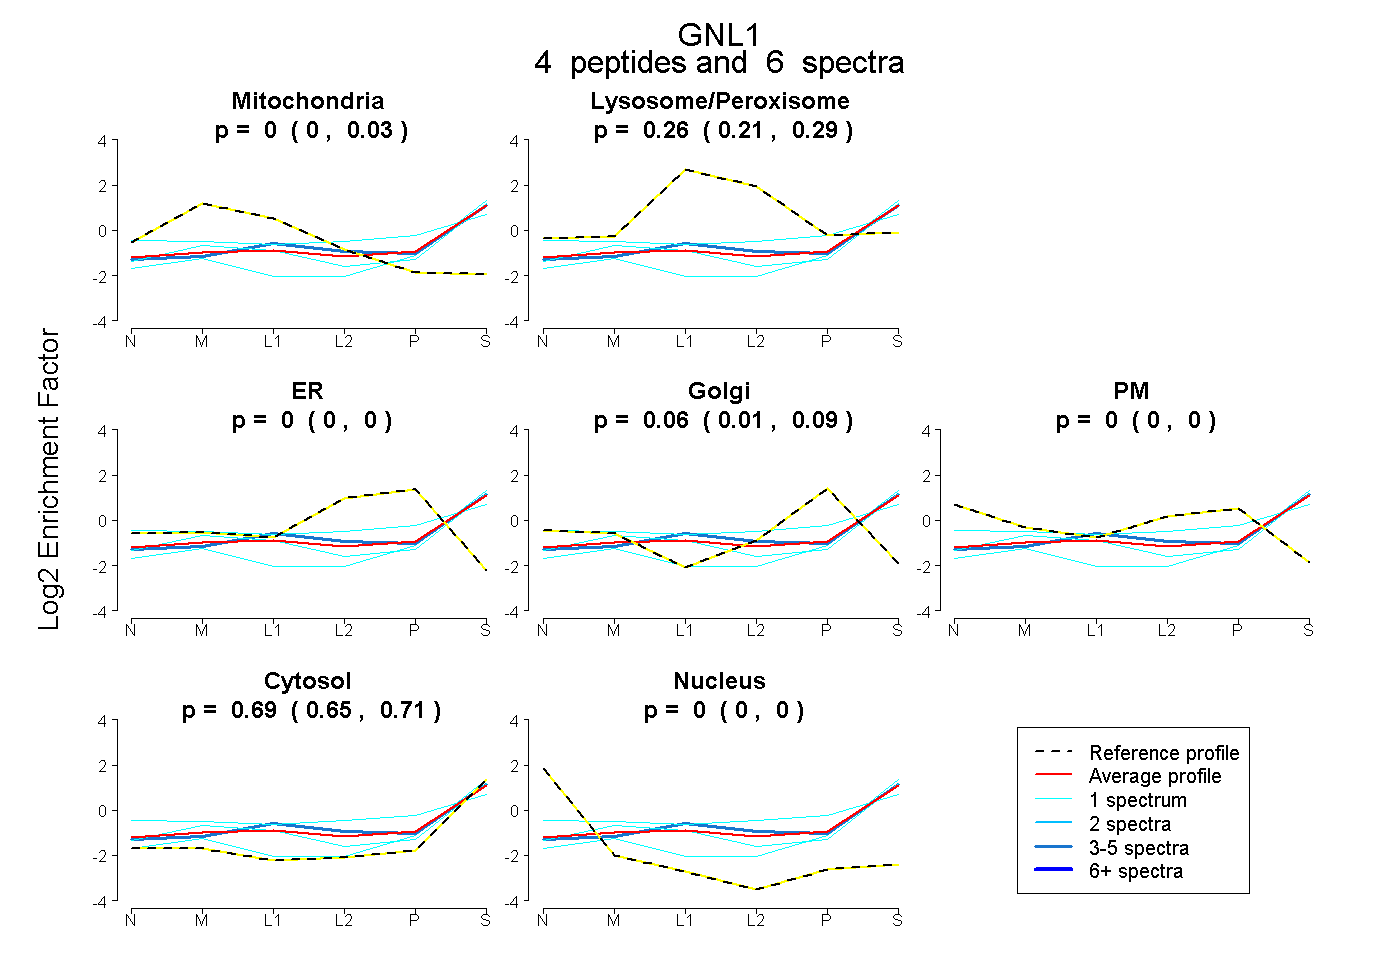 |
0.000
0.000 | 0.033 |
|
0.256
0.210 | 0.287 |
|
0.000
0.000 | 0.000 |
0.057
0.015 | 0.089 |
0.000
0.000 | 0.001 |
0.686
0.650 | 0.714 |
0.000
0.000 | 0.000 |
|
| 3 spectra, ALGPEQLLR |
0.000 |
|
0.316 |
|
0.000 |
0.004 |
0.000 |
0.680 |
0.000 |
|
| 1 spectrum, IPVQALLHLR |
0.112 |
|
0.164 |
|
0.000 |
0.000 |
0.000 |
0.724 |
0.000 |
|
| 1 spectrum, SSLINGLVGR |
0.000 |
|
0.289 |
|
0.000 |
0.095 |
0.174 |
0.442 |
0.000 |
|
| 1 spectrum, AANSLLR |
0.000 |
|
0.019 |
|
0.000 |
0.098 |
0.000 |
0.883 |
0.000 |
|
| | | Plot |
|
Lyso |
|
|
|
|
|
|
|
Other |
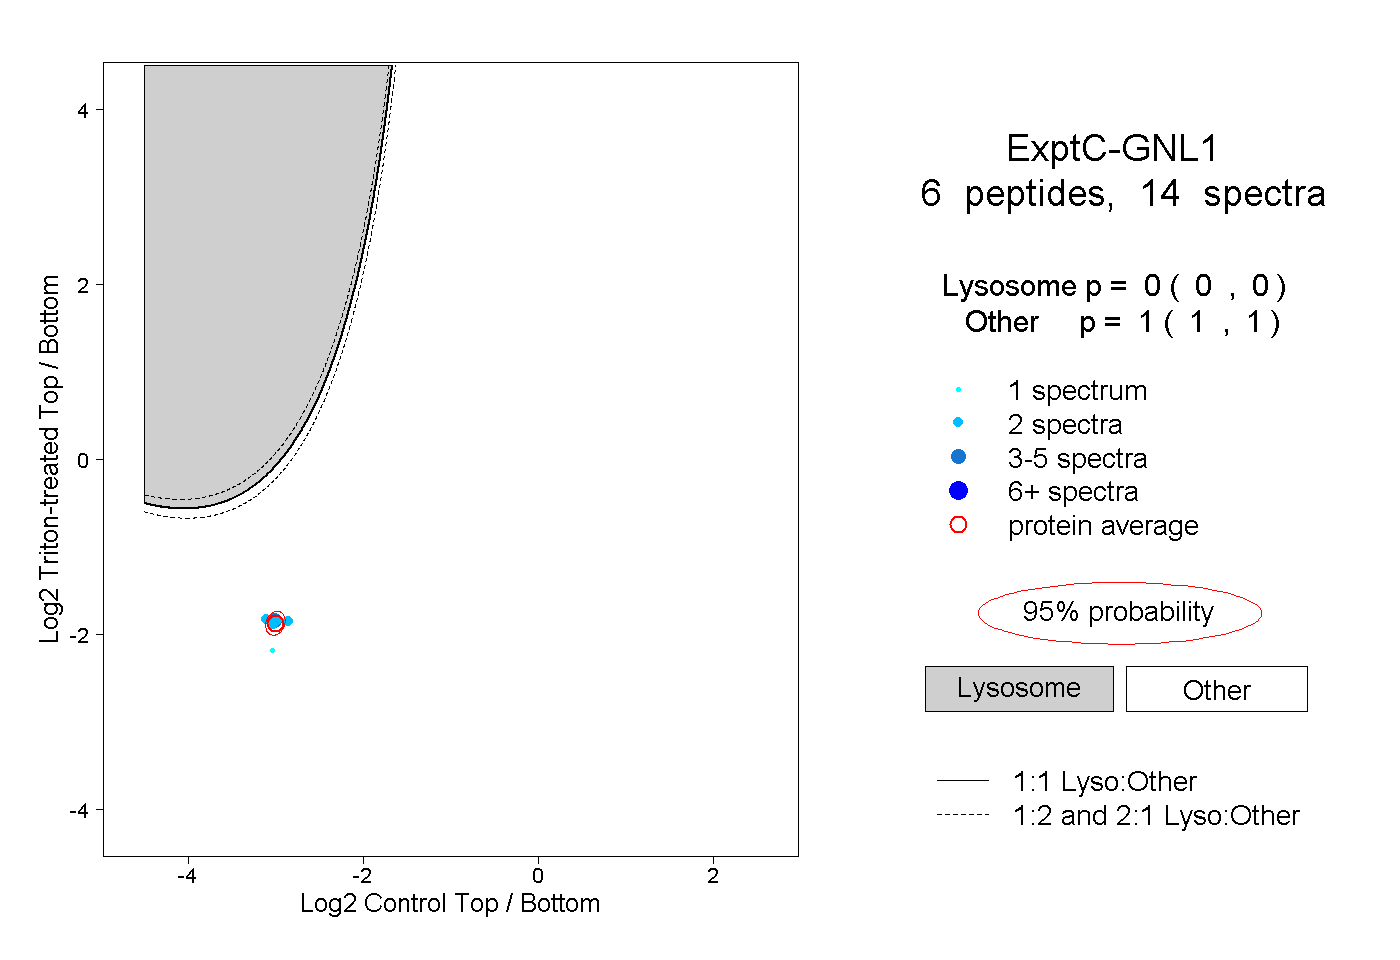
| Expt C |
6
peptides |
14
spectra |
 |
|
0.000
0.000 | 0.000 |
|
|
|
|
|
|
|
1.000
1.000 | 1.000 |