 21
21peptides
spectra

0.000 | 0.000
0.000 | 0.000
0.000 | 0.007
0.052 | 0.079
0.137 | 0.164
0.285 | 0.311
0.475 | 0.485
0.000 | 0.000
2peptides
spectra
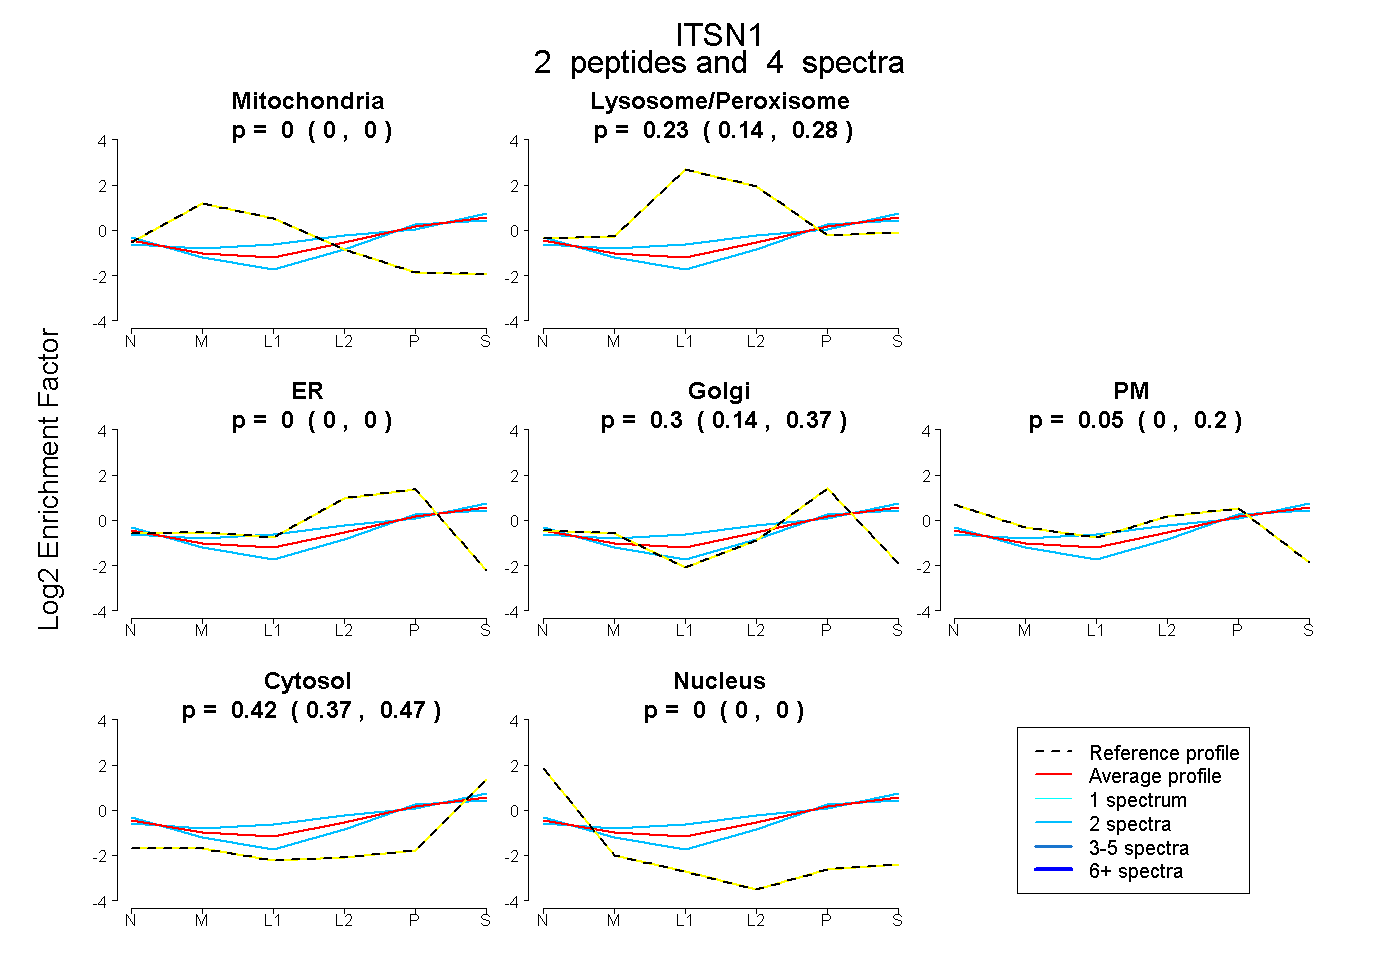
0.000 | 0.000
0.141 | 0.276
0.000 | 0.000
0.138 | 0.371
0.000 | 0.198
0.374 | 0.475
0.000 | 0.000
19peptides
spectra
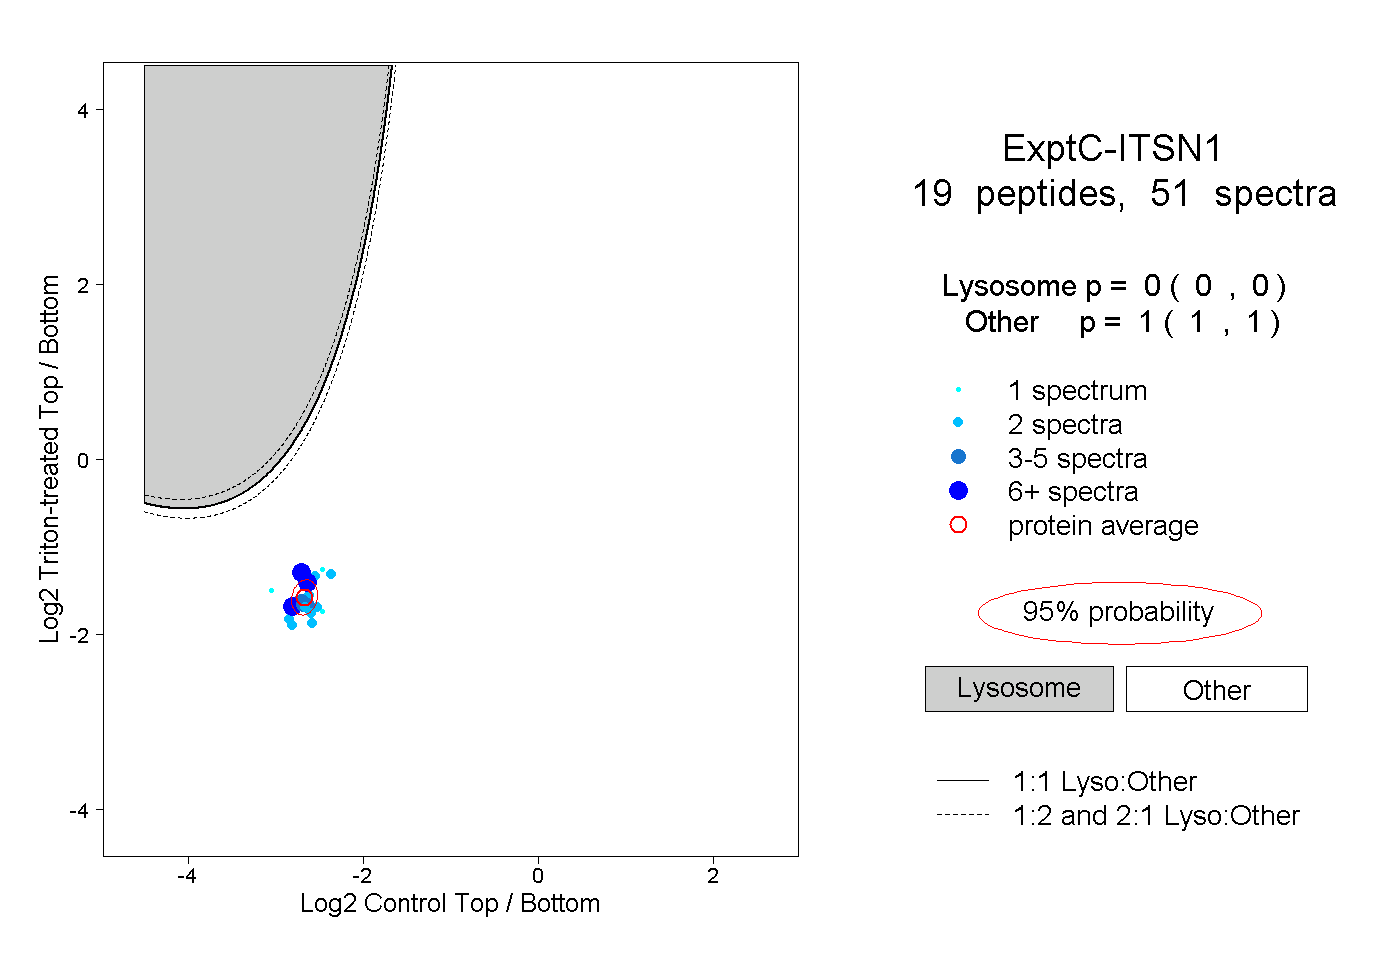
0.000 | 0.000
1.000 | 1.000
3peptides
spectra
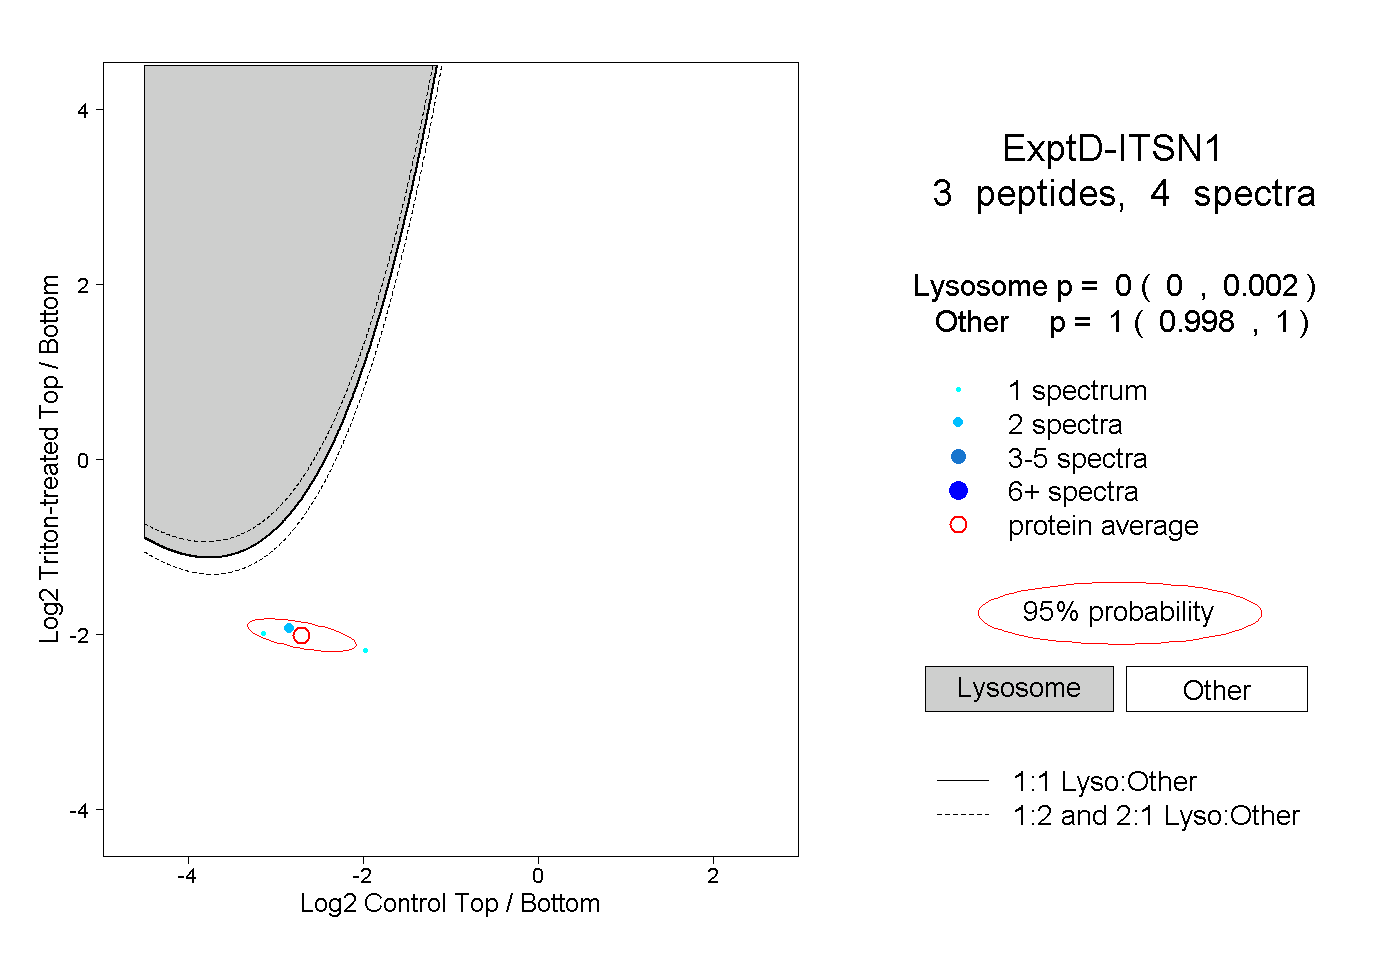
0.000 | 0.002
0.998 | 1.000