ITSN1
[ENSRNOP00000045513]
Main page
| | | Plot |
Mito |
Lyso |
|
Perox |
ER |
Golgi |
PM |
Cytosol |
Nucleus |
|
| Expt A |
 21
21
peptides |
42
spectra |
 |
0.000
0.000 | 0.000 |
0.000
0.000 | 0.000 |
|
0.000
0.000 | 0.007 |
0.068
0.052 | 0.079 |
0.149
0.137 | 0.164 |
0.301
0.285 | 0.311 |
0.481
0.475 | 0.485 |
0.000
0.000 | 0.000 |
|
| | | Plot |
Mito |
|
Lyso or Perox |
|
ER |
Golgi |
PM |
Cytosol |
Nucleus |
|
| Expt B |
2
peptides |
4
spectra |
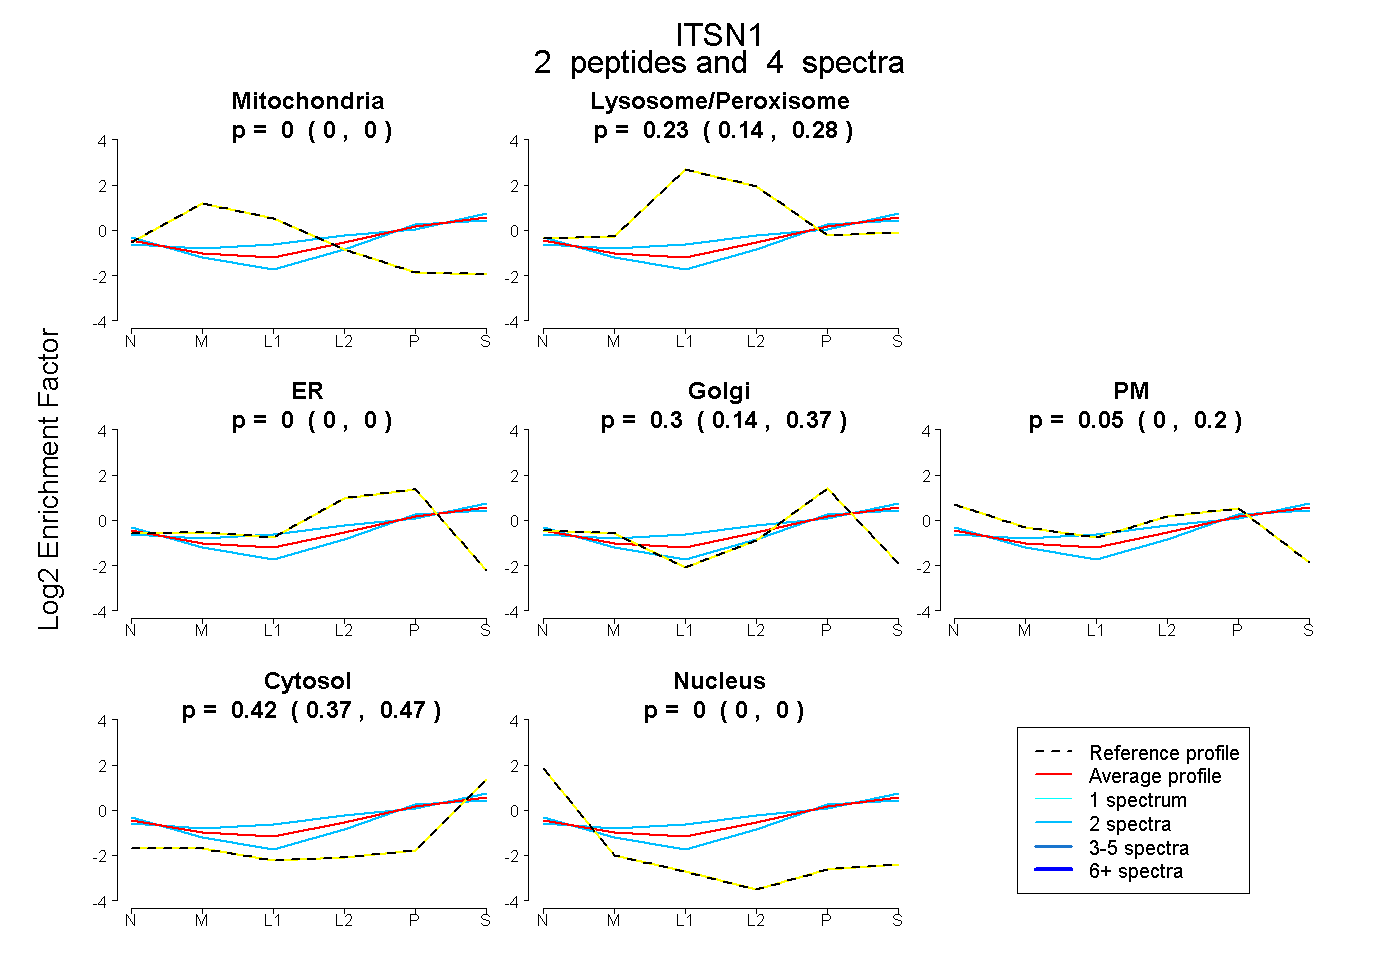 |
0.000
0.000 | 0.000 |
|
0.227
0.141 | 0.276 |
|
0.000
0.000 | 0.000 |
0.301
0.138 | 0.371 |
0.049
0.000 | 0.198 |
0.424
0.374 | 0.475 |
0.000
0.000 | 0.000 |
|
| 2 spectra, GQIINVLSK |
0.000 |
|
0.354 |
|
0.000 |
0.244 |
0.000 |
0.402 |
0.000 |
|
| 2 spectra, ALYPFESR |
0.000 |
|
0.075 |
|
0.000 |
0.295 |
0.177 |
0.453 |
0.000 |
|
| | | Plot |
|
Lyso |
|
|
|
|
|
|
|
Other |
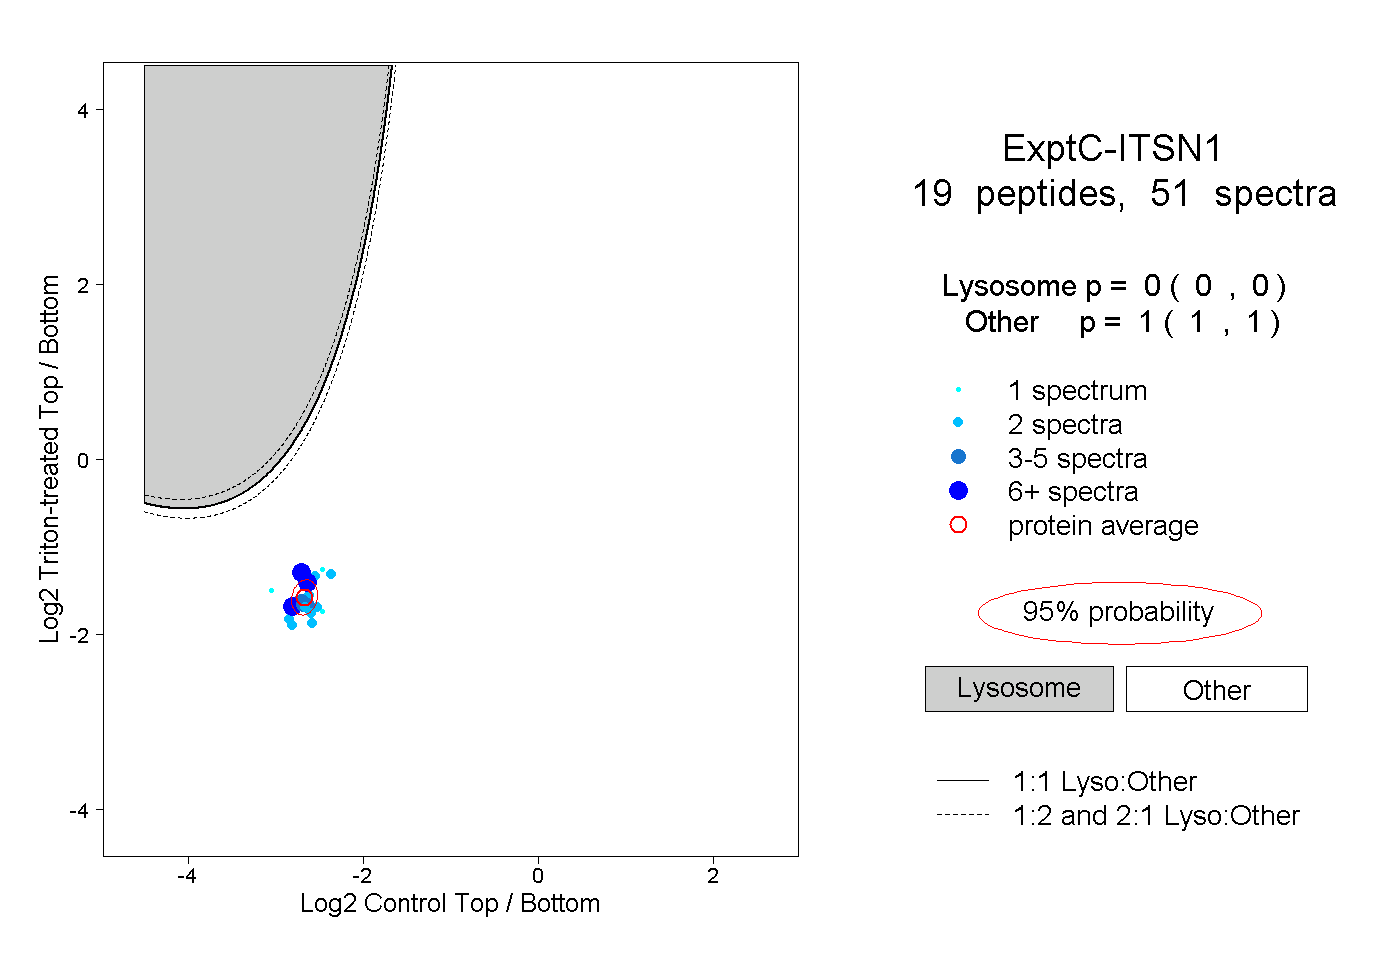
| Expt C |
19
peptides |
51
spectra |
 |
|
0.000
0.000 | 0.000 |
|
|
|
|
|
|
|
1.000
1.000 | 1.000 |
| | | Plot |
|
Lyso |
|
|
|
|
|
|
|
Other |
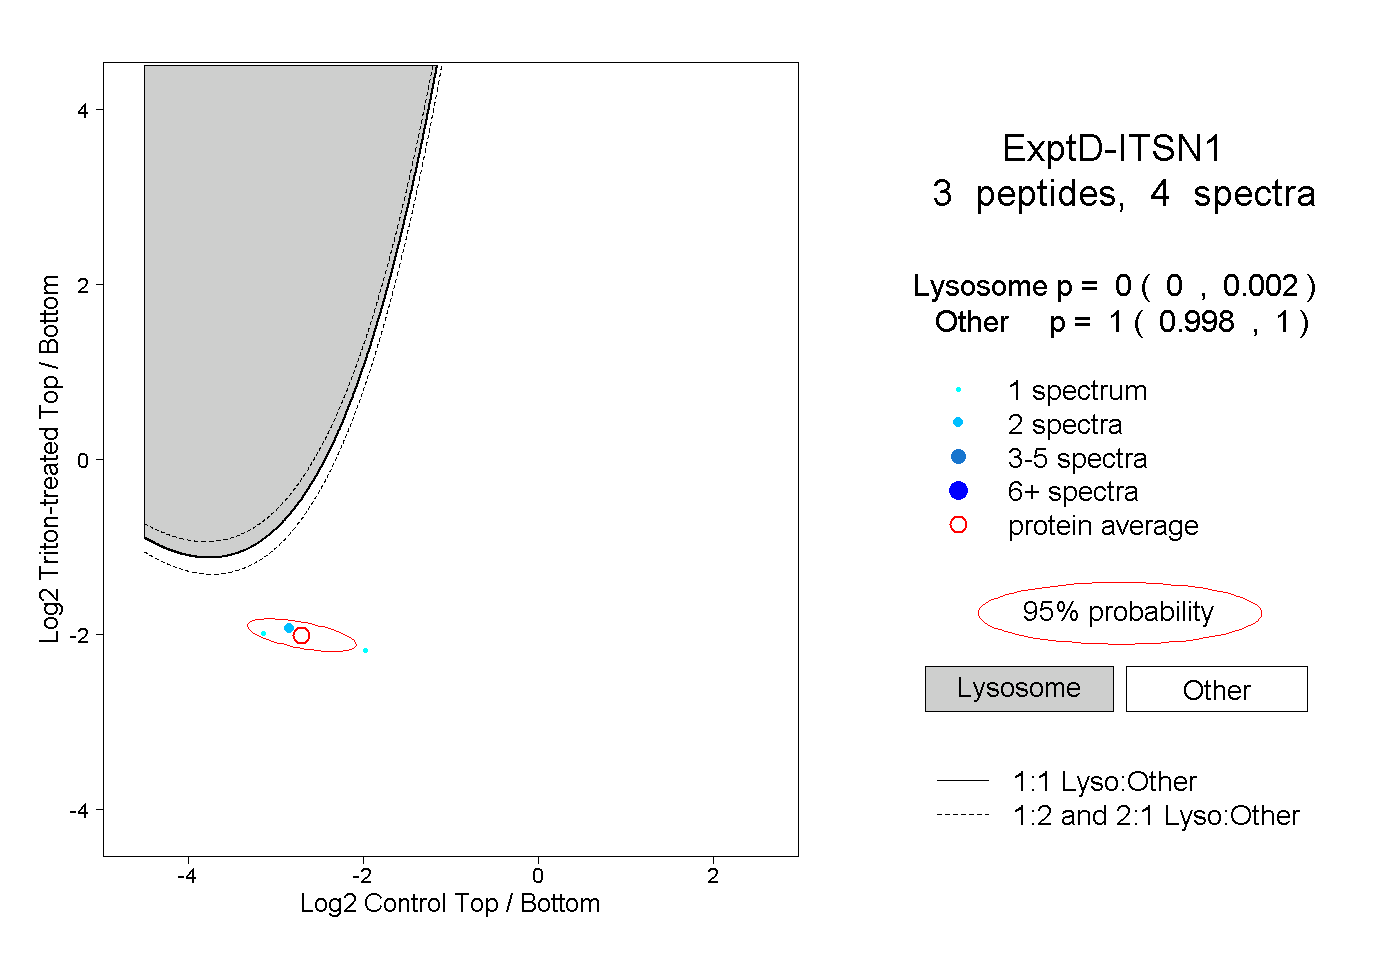
| Expt D |
3
peptides |
4
spectra |
 |
|
0.000
0.000 | 0.002 |
|
|
|
|
|
|
|
1.000
0.998 | 1.000 |