 24
24peptides
spectra
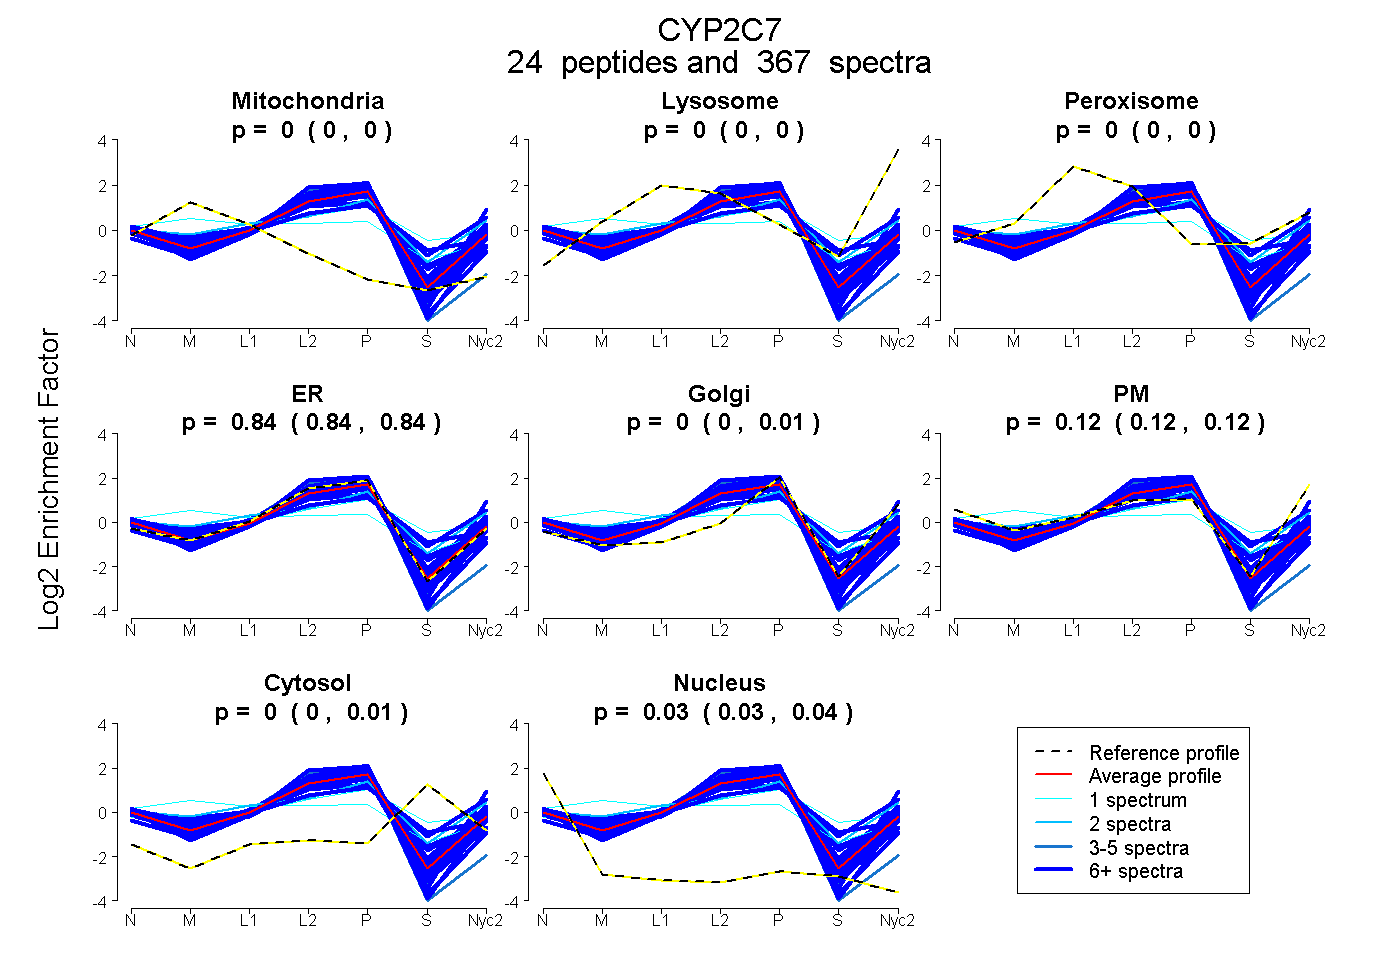
0.000 | 0.000
0.000 | 0.000
0.000 | 0.000
0.835 | 0.843
0.000 | 0.005
0.118 | 0.124
0.000 | 0.006
0.032 | 0.035
20peptides
spectra
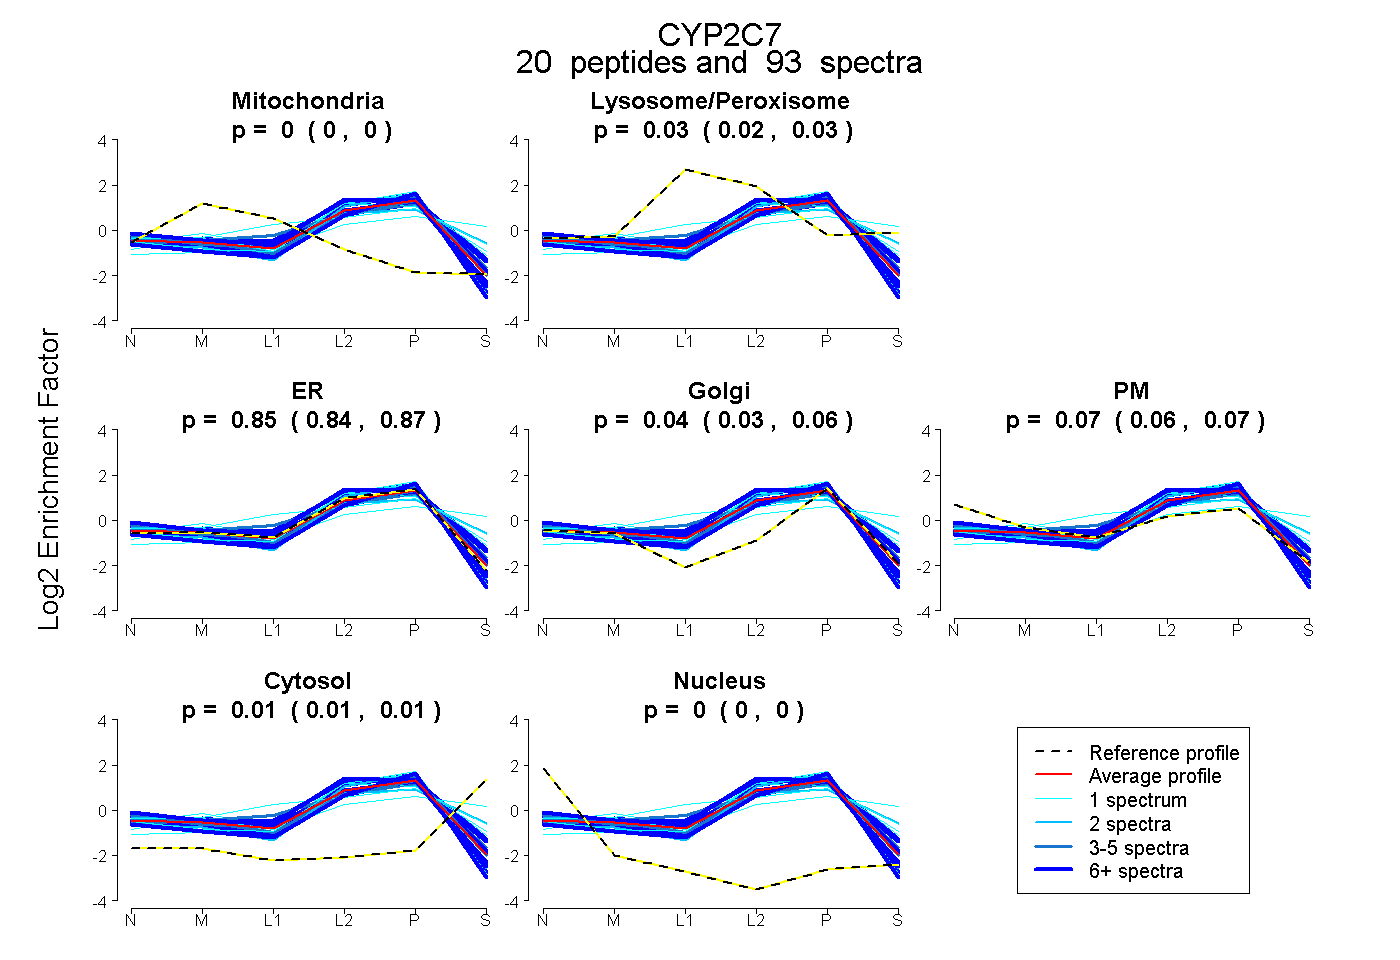
0.000 | 0.000
0.017 | 0.033
0.838 | 0.867
0.026 | 0.057
0.056 | 0.075
0.007 | 0.015
0.000 | 0.000
24peptides
spectra
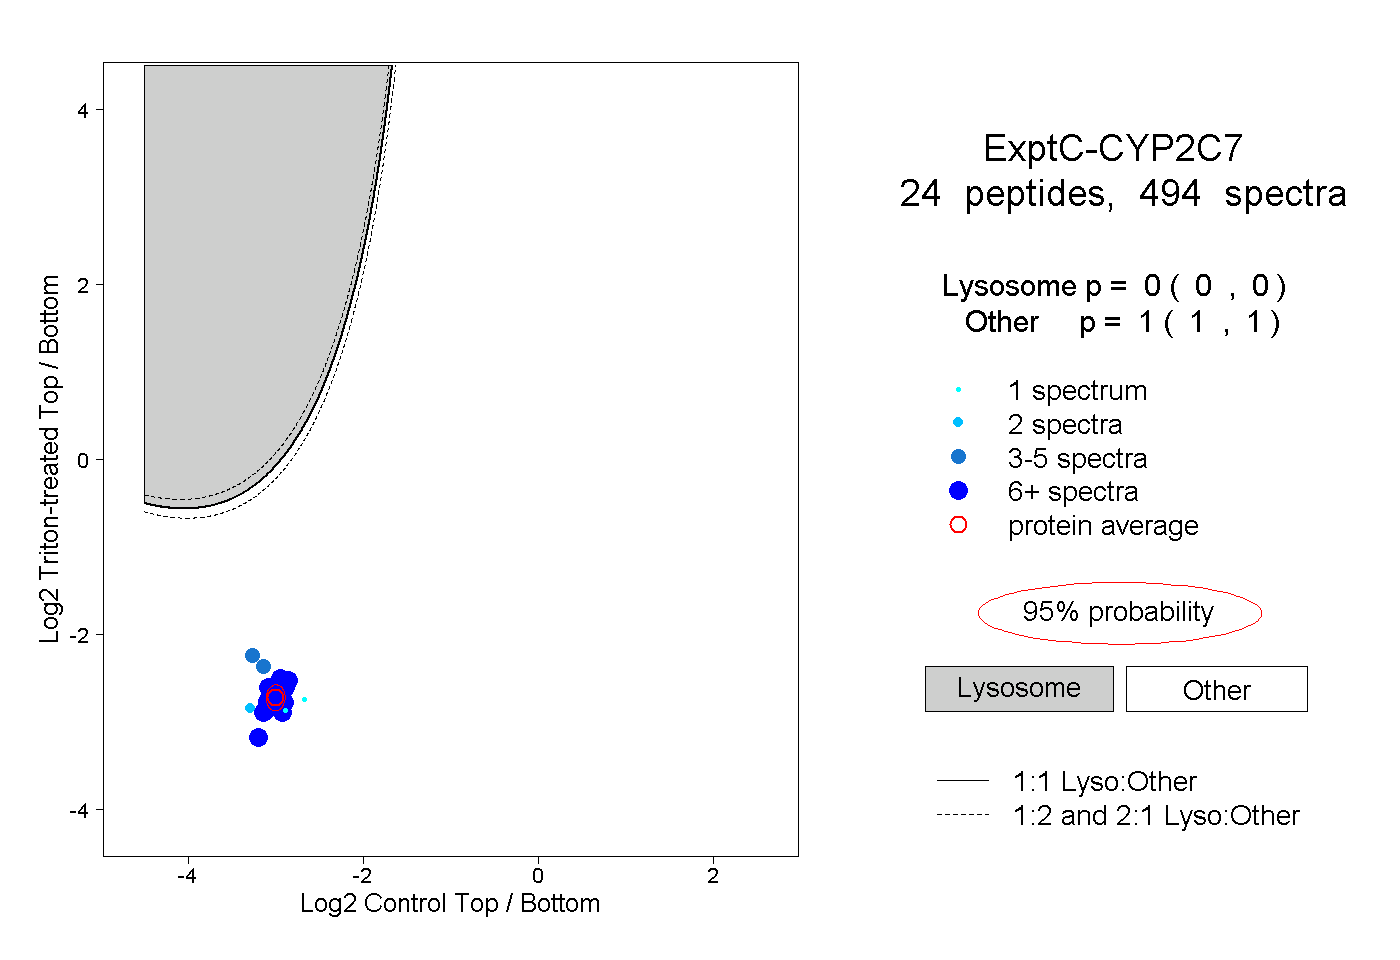
0.000 | 0.000
1.000 | 1.000
15peptides
spectra
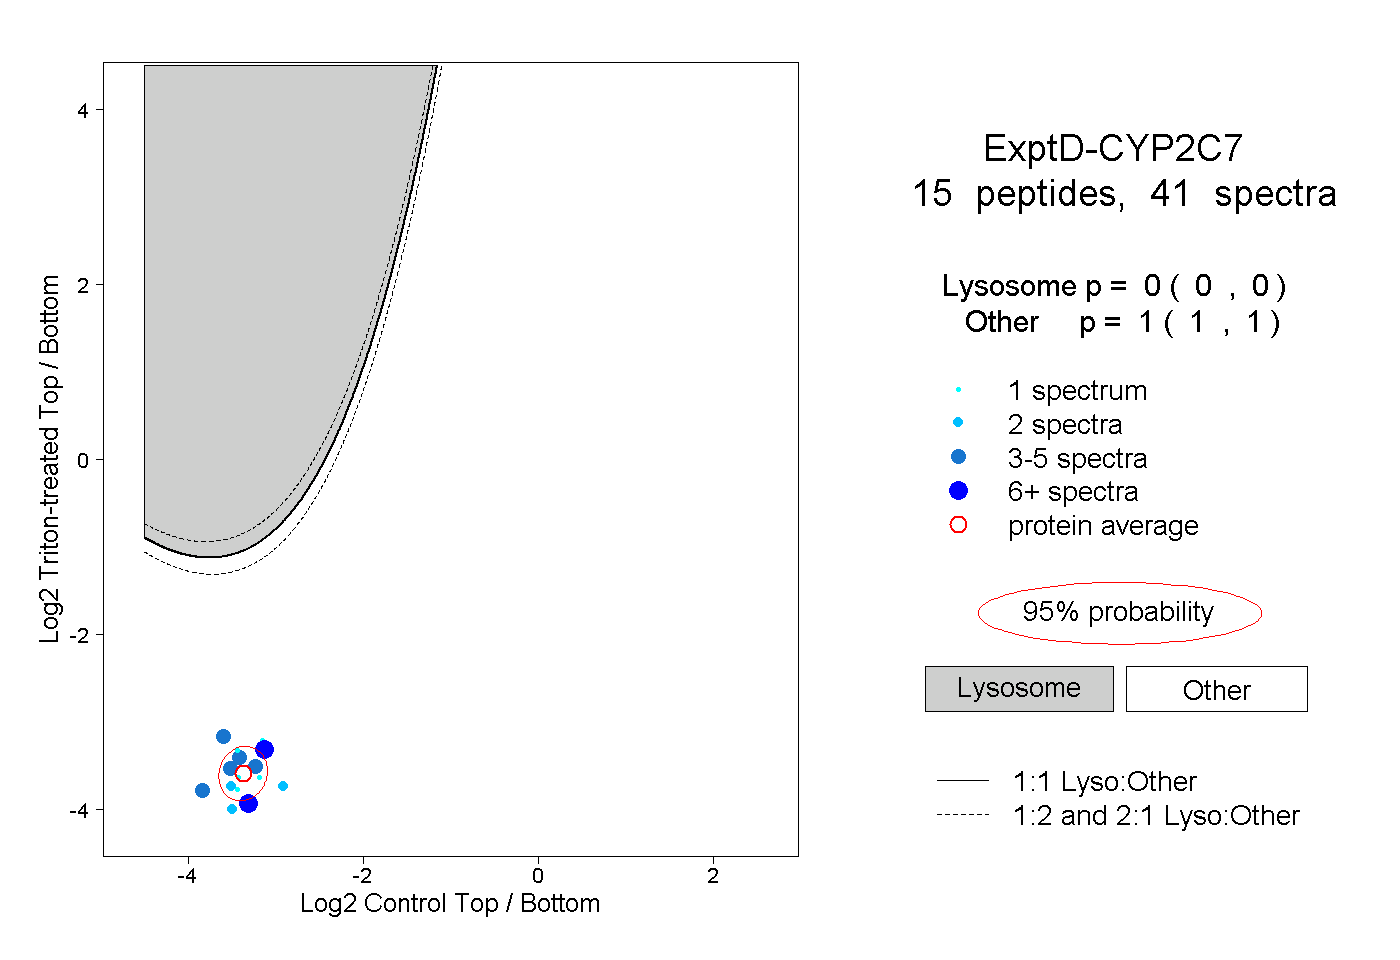
0.000 | 0.000
1.000 | 1.000