 24
24peptides
spectra
0.000 | 0.000
0.000 | 0.000
0.000 | 0.000
0.835 | 0.843
0.000 | 0.005
0.118 | 0.124
0.000 | 0.006
0.032 | 0.035
| Plot | Mito | Lyso | Perox | ER | Golgi | PM | Cytosol | Nucleus | |||||
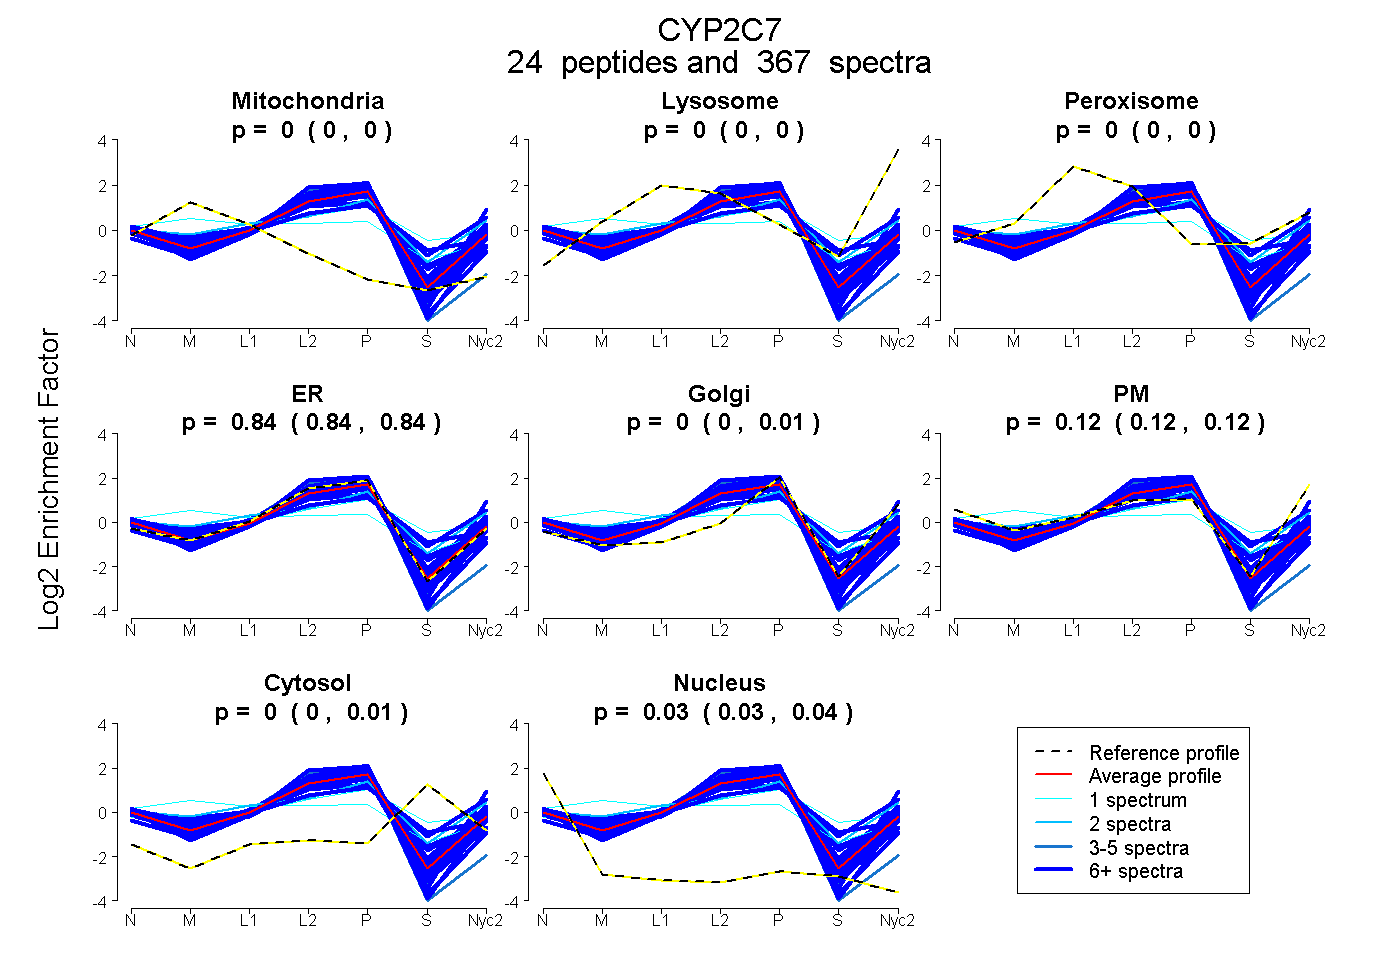
| Expt A |
24 peptides |
367 spectra |
|
0.000 0.000 | 0.000 |
0.000 0.000 | 0.000 |
0.000 0.000 | 0.000 |
0.840 0.835 | 0.843 |
0.002 0.000 | 0.005 |
0.121 0.118 | 0.124 |
0.003 0.000 | 0.006 |
0.034 0.032 | 0.035 |
| 2 spectra, VLTSLTSVLHDSK | 0.025 | 0.000 | 0.280 | 0.123 | 0.486 | 0.068 | 0.019 | 0.000 | ||
| 20 spectra, VQEELDR | 0.000 | 0.000 | 0.000 | 0.885 | 0.057 | 0.033 | 0.000 | 0.025 | ||
| 29 spectra, FTIMTFR | 0.000 | 0.000 | 0.000 | 0.569 | 0.061 | 0.370 | 0.000 | 0.000 | ||
| 1 spectrum, NLGIGK | 0.302 | 0.000 | 0.195 | 0.172 | 0.181 | 0.095 | 0.055 | 0.000 | ||
| 1 spectrum, EMLTFMEK | 0.012 | 0.000 | 0.270 | 0.265 | 0.238 | 0.000 | 0.216 | 0.000 | ||
| 17 spectra, VNENLK | 0.000 | 0.000 | 0.000 | 0.855 | 0.014 | 0.099 | 0.000 | 0.033 | ||
| 11 spectra, NINYMK | 0.000 | 0.000 | 0.000 | 0.824 | 0.000 | 0.176 | 0.000 | 0.000 | ||
| 7 spectra, GSYPMIENVTK | 0.000 | 0.000 | 0.089 | 0.673 | 0.099 | 0.036 | 0.102 | 0.000 | ||
| 3 spectra, FINFVPTNLPHAVTCDIK | 0.000 | 0.000 | 0.000 | 0.920 | 0.000 | 0.000 | 0.000 | 0.080 | ||
| 44 spectra, SPCMQDR | 0.000 | 0.000 | 0.000 | 0.876 | 0.099 | 0.000 | 0.000 | 0.025 | ||
| 38 spectra, ACVGEGLAR | 0.000 | 0.000 | 0.000 | 0.944 | 0.000 | 0.000 | 0.000 | 0.056 | ||
| 7 spectra, SYLLK | 0.000 | 0.000 | 0.000 | 0.703 | 0.133 | 0.102 | 0.050 | 0.012 | ||
| 23 spectra, EALIDNGEK | 0.000 | 0.000 | 0.000 | 0.922 | 0.001 | 0.058 | 0.005 | 0.014 | ||
| 18 spectra, GFGIVFSNGNR | 0.000 | 0.000 | 0.000 | 1.000 | 0.000 | 0.000 | 0.000 | 0.000 | ||
| 20 spectra, DFVDYYLIK | 0.000 | 0.000 | 0.049 | 0.780 | 0.000 | 0.026 | 0.145 | 0.000 | ||
| 29 spectra, YALLLLMK | 0.000 | 0.000 | 0.000 | 0.802 | 0.028 | 0.134 | 0.000 | 0.035 | ||
| 6 spectra, SDYFLPFSAGK | 0.145 | 0.000 | 0.000 | 0.847 | 0.000 | 0.000 | 0.000 | 0.008 | ||
| 14 spectra, EILTFMEK | 0.000 | 0.000 | 0.000 | 0.773 | 0.097 | 0.128 | 0.002 | 0.000 | ||
| 4 spectra, EFPNPEMFDPGHFLDENGNFK | 0.000 | 0.000 | 0.000 | 0.859 | 0.000 | 0.141 | 0.000 | 0.000 | ||
| 12 spectra, NISQSLTK | 0.000 | 0.000 | 0.000 | 0.795 | 0.000 | 0.153 | 0.016 | 0.035 | ||
| 28 spectra, HMPYTDAMIHEVQR | 0.000 | 0.000 | 0.110 | 0.310 | 0.064 | 0.359 | 0.157 | 0.000 | ||
| 9 spectra, VQEEAQCLVEELR | 0.000 | 0.000 | 0.000 | 0.965 | 0.000 | 0.000 | 0.000 | 0.035 | ||
| 10 spectra, YPHVTAK | 0.031 | 0.000 | 0.115 | 0.536 | 0.000 | 0.100 | 0.219 | 0.000 | ||
| 14 spectra, IEEHQESLDVTNPR | 0.000 | 0.000 | 0.021 | 0.656 | 0.000 | 0.270 | 0.053 | 0.000 |
| Plot | Mito | Lyso or Perox | ER | Golgi | PM | Cytosol | Nucleus | ||||||
| Expt B |
20 peptides |
93 spectra |
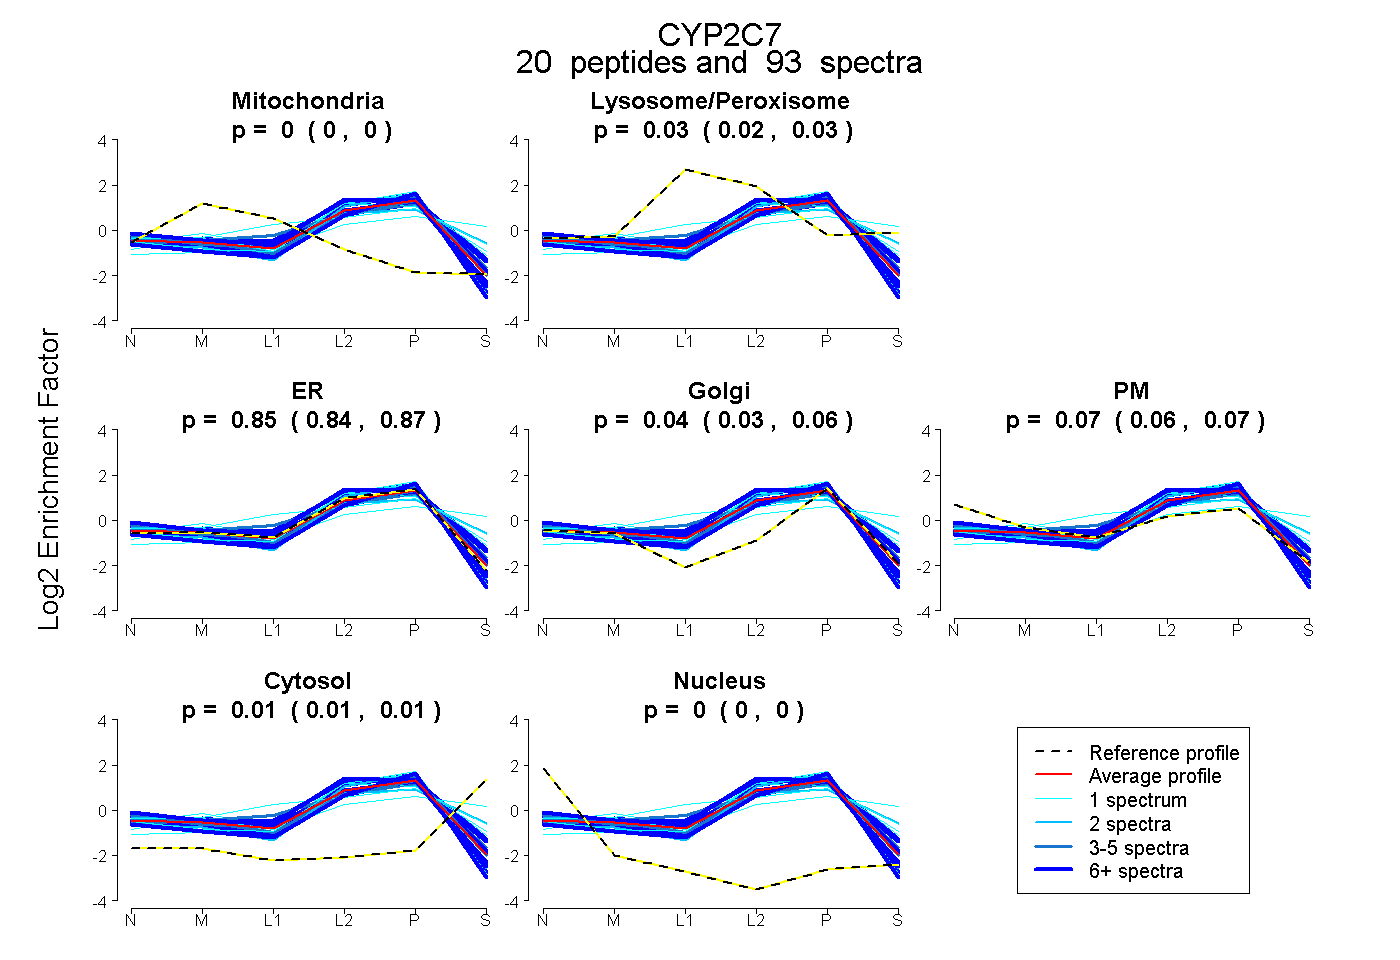 |
0.000 0.000 | 0.000 |
0.026 0.017 | 0.033 |
0.853 0.838 | 0.867 |
0.043 0.026 | 0.057 |
0.066 0.056 | 0.075 |
0.012 0.007 | 0.015 |
0.000 0.000 | 0.000 |
|||
| Plot | Lyso | Other | |||||||||||
| Expt C |
24 peptides |
494 spectra |
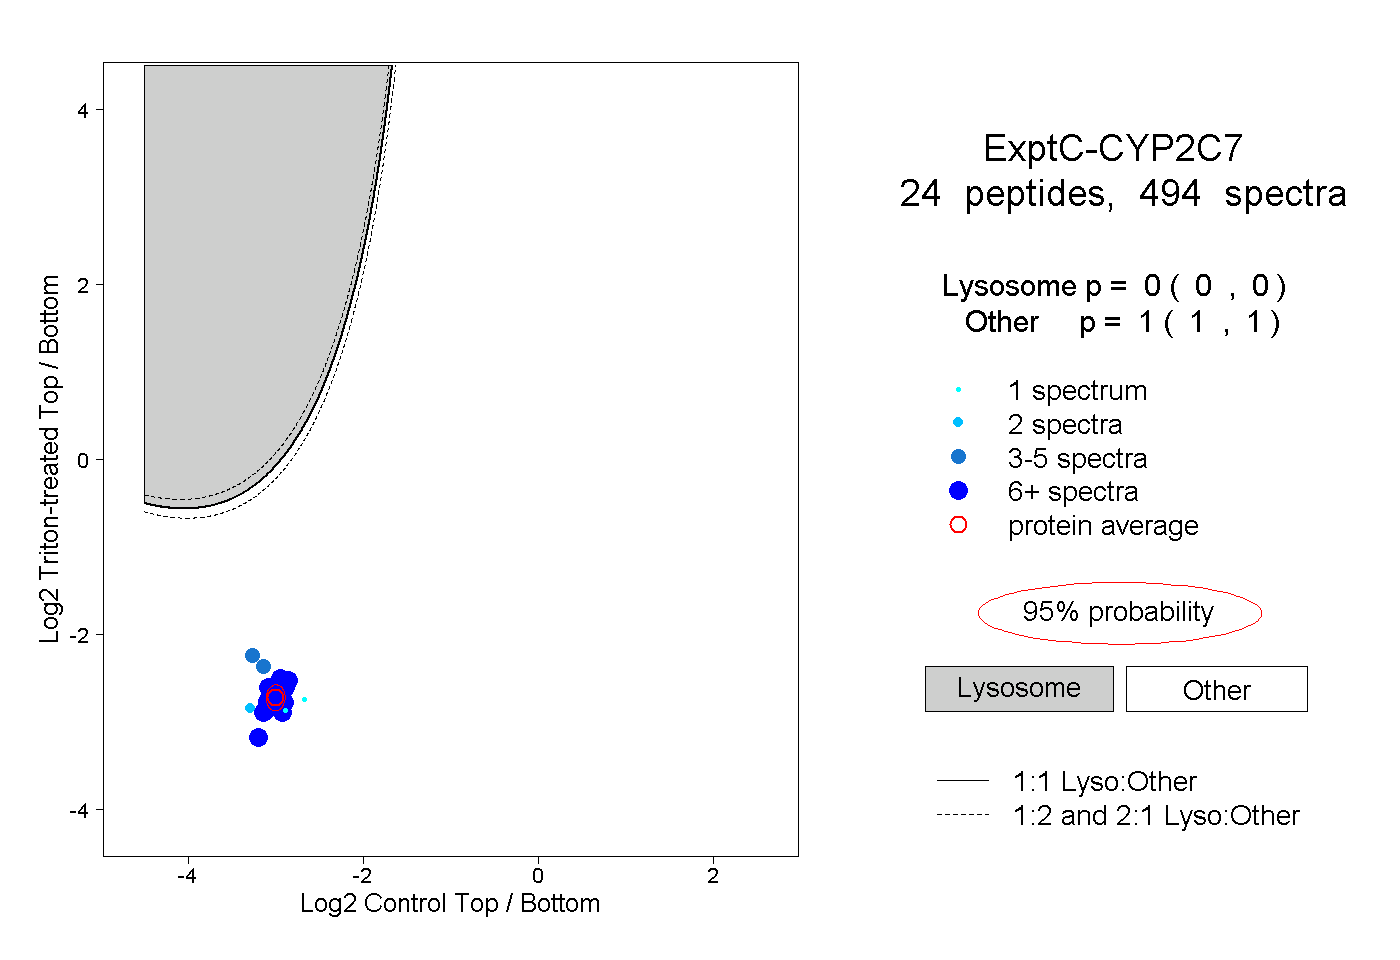 |
0.000 0.000 | 0.000 |
1.000 1.000 | 1.000 |
||||||||
| Plot | Lyso | Other | |||||||||||
| Expt D |
15 peptides |
41 spectra |
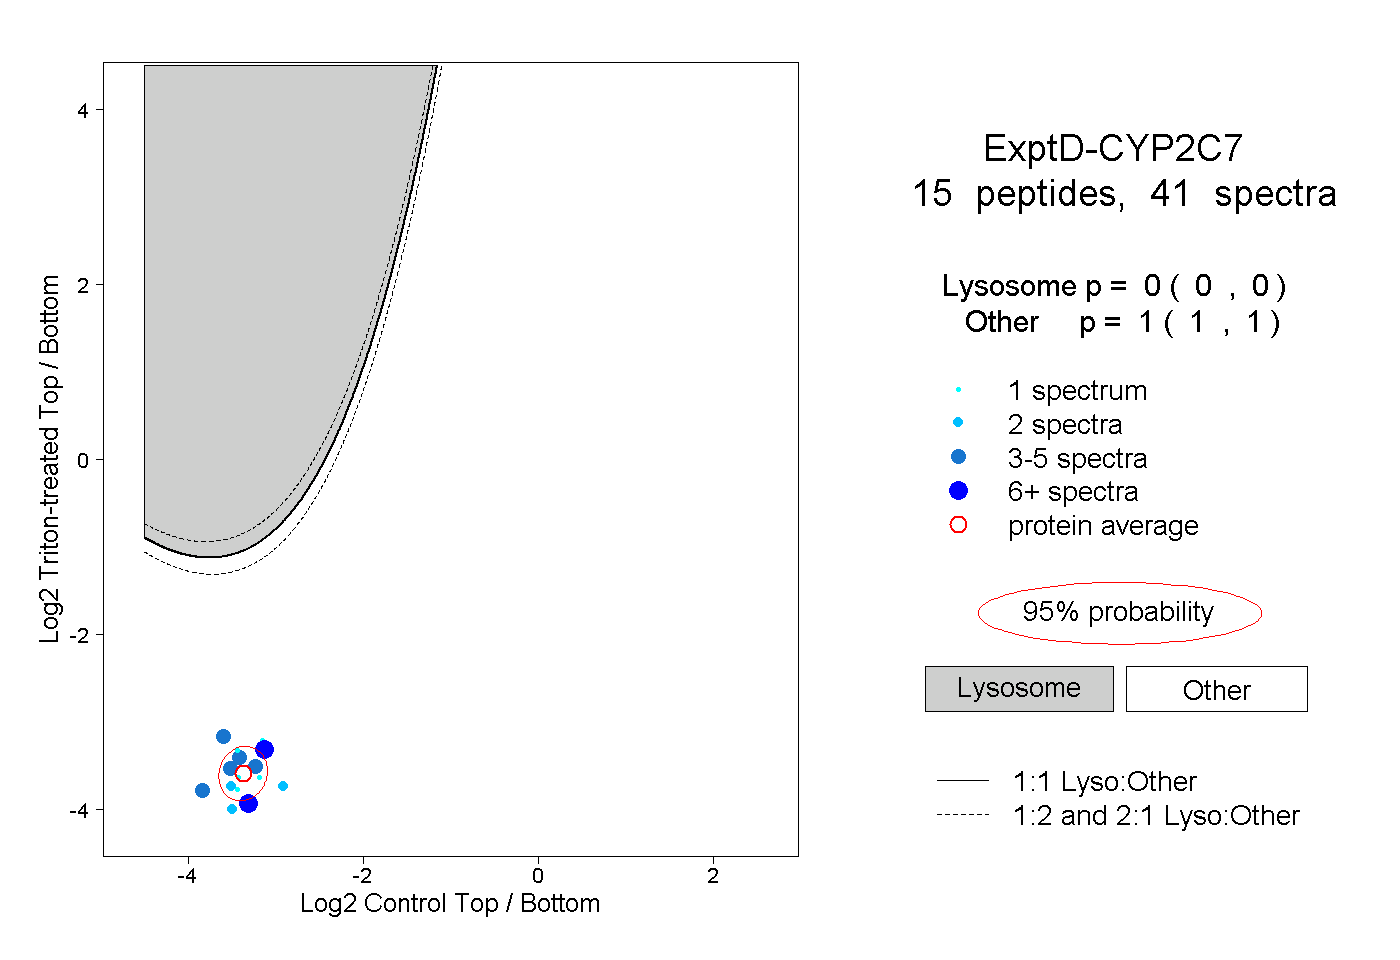 |
0.000 0.000 | 0.000 |
1.000 1.000 | 1.000 |