 13
13peptides
spectra
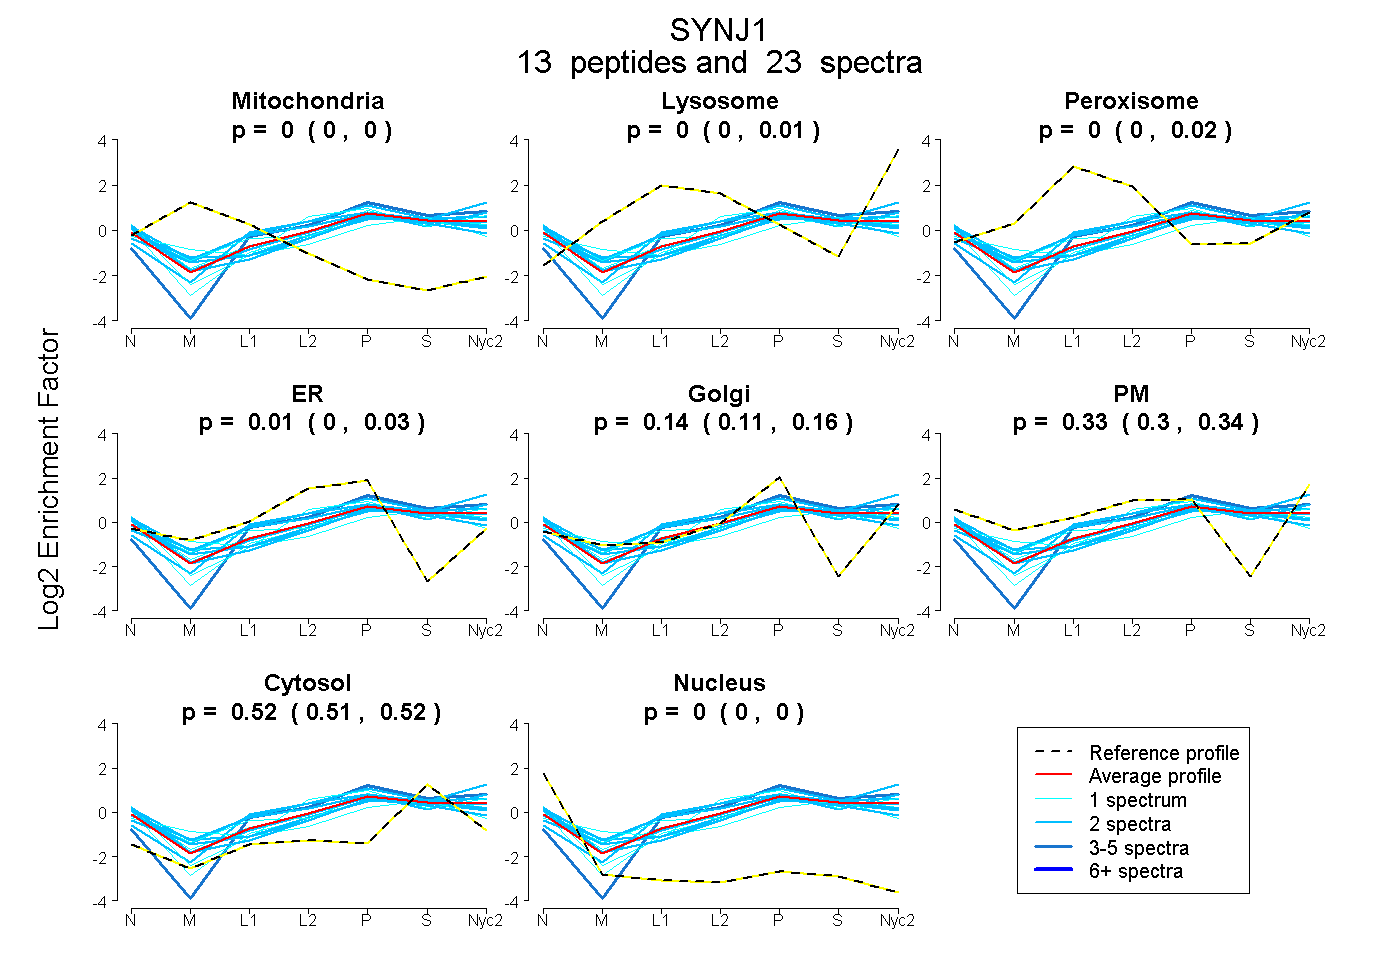
0.000 | 0.000
0.000 | 0.007
0.000 | 0.022
0.000 | 0.034
0.111 | 0.164
0.297 | 0.345
0.505 | 0.524
0.000 | 0.000
3peptides
spectra
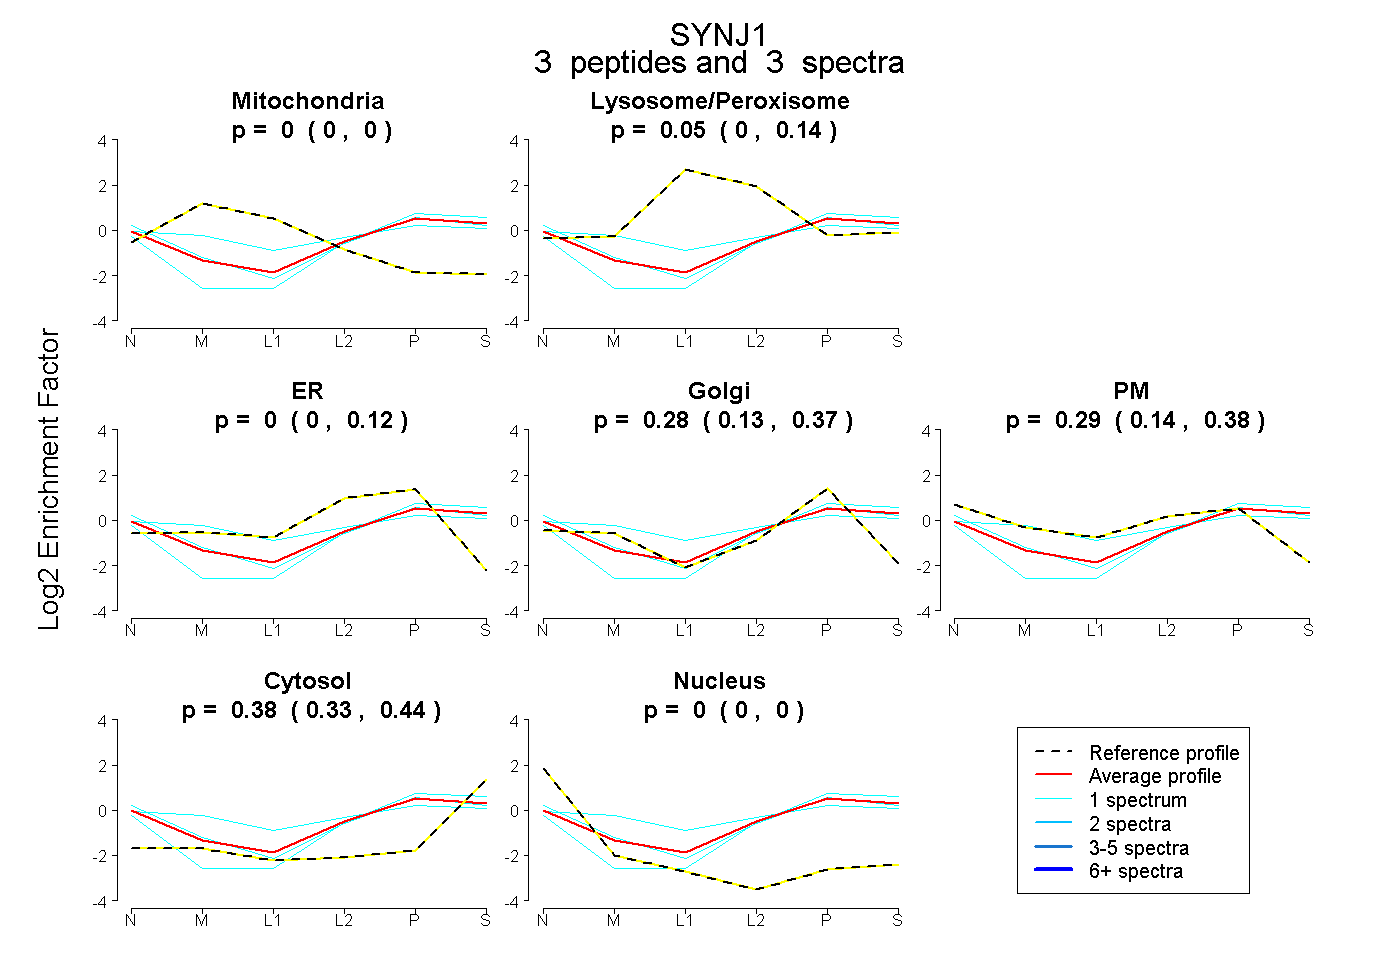
0.000 | 0.000
0.000 | 0.137
0.000 | 0.124
0.130 | 0.371
0.140 | 0.378
0.326 | 0.442
0.000 | 0.000
6peptides
spectra
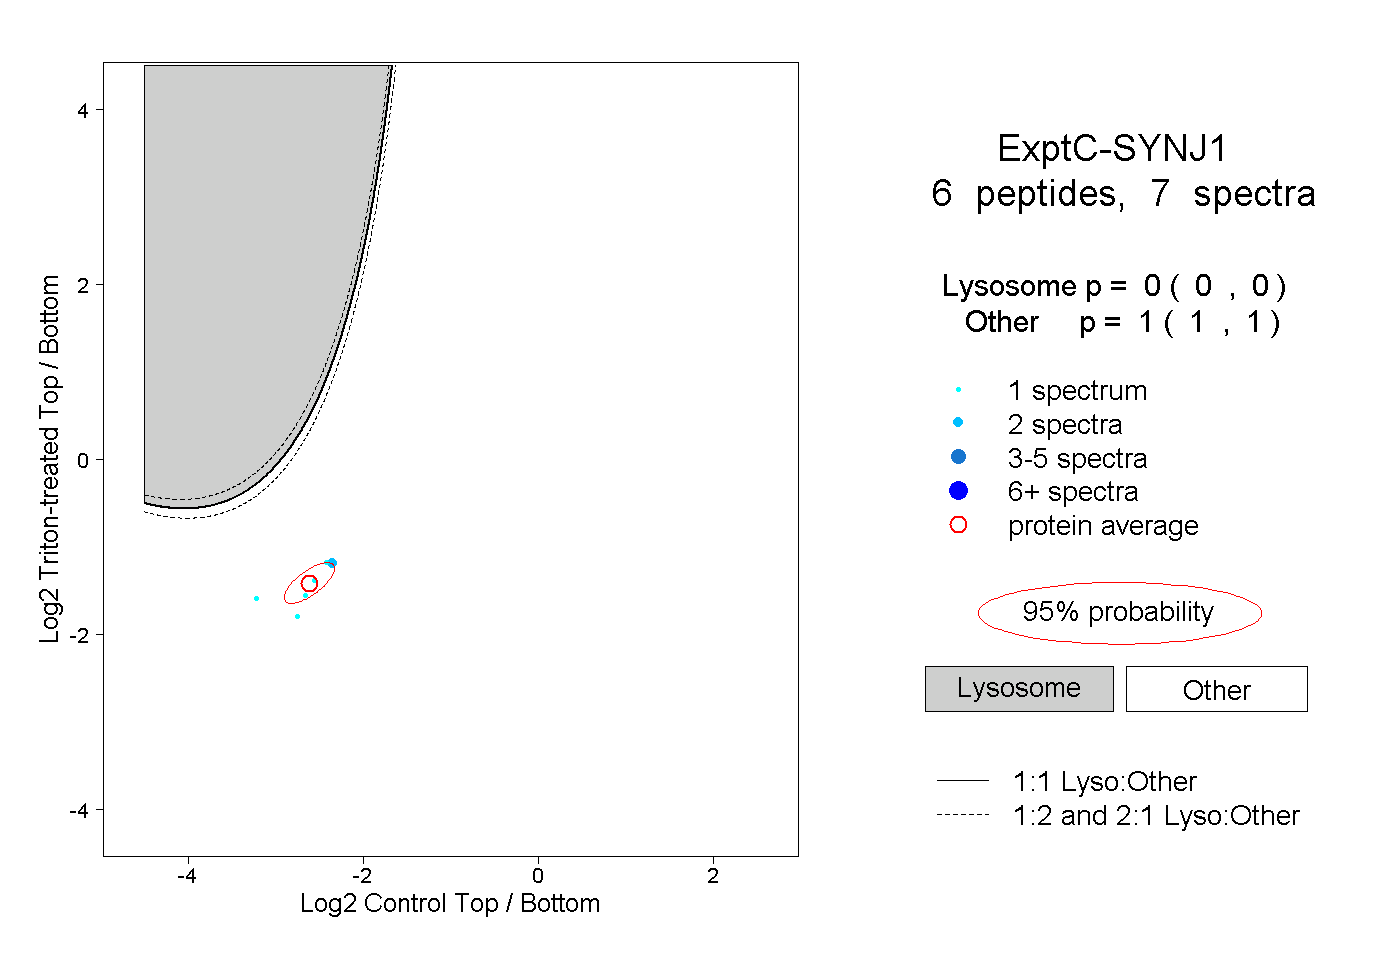
0.000 | 0.000
1.000 | 1.000