 13
13peptides
spectra
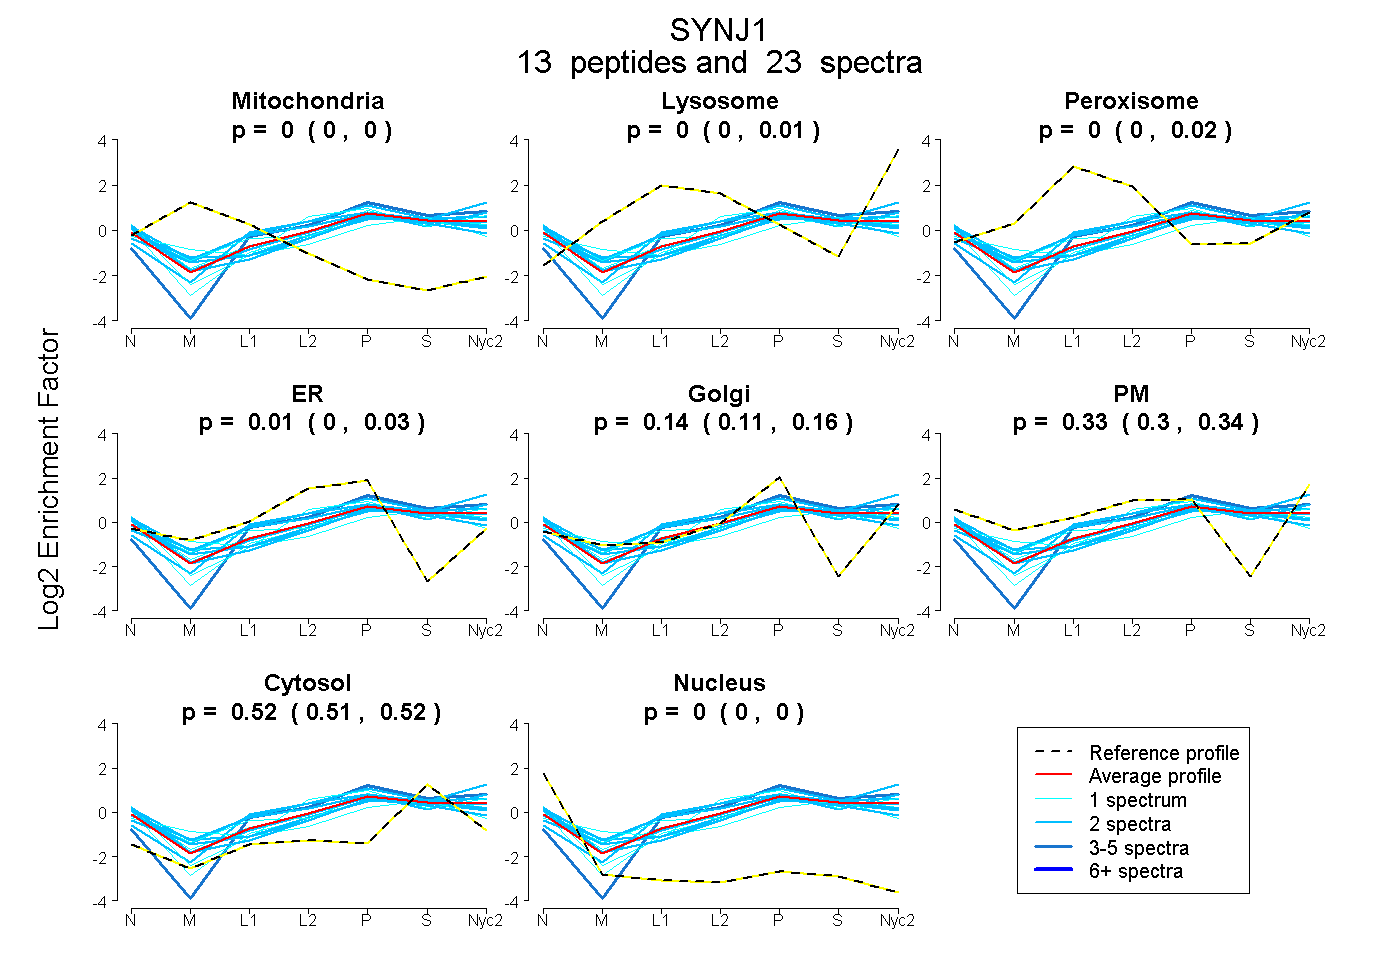
0.000 | 0.000
0.000 | 0.007
0.000 | 0.022
0.000 | 0.034
0.111 | 0.164
0.297 | 0.345
0.505 | 0.524
0.000 | 0.000
| Plot | Mito | Lyso | Perox | ER | Golgi | PM | Cytosol | Nucleus | |||||
| Expt A |
13 peptides |
23 spectra |
|
0.000 0.000 | 0.000 |
0.000 0.000 | 0.007 |
0.004 0.000 | 0.022 |
0.012 0.000 | 0.034 |
0.137 0.111 | 0.164 |
0.329 0.297 | 0.345 |
0.517 0.505 | 0.524 |
0.000 0.000 | 0.000 |
| 1 spectrum, VTFAPTYK | 0.000 | 0.000 | 0.130 | 0.000 | 0.198 | 0.189 | 0.483 | 0.000 | ||
| 2 spectra, VLDAYGLLGVLR | 0.000 | 0.000 | 0.000 | 0.024 | 0.254 | 0.173 | 0.545 | 0.004 | ||
| 1 spectrum, TNCLDCLDR | 0.030 | 0.000 | 0.037 | 0.000 | 0.193 | 0.165 | 0.575 | 0.000 | ||
| 2 spectra, GTNVSFCVLPAR | 0.000 | 0.188 | 0.000 | 0.229 | 0.110 | 0.000 | 0.472 | 0.000 | ||
| 4 spectra, AGVISAPQSQAR | 0.000 | 0.111 | 0.000 | 0.068 | 0.277 | 0.000 | 0.544 | 0.000 | ||
| 1 spectrum, ALLTTGSLR | 0.000 | 0.000 | 0.000 | 0.000 | 0.277 | 0.145 | 0.578 | 0.000 | ||
| 2 spectra, NPFTDR | 0.000 | 0.245 | 0.000 | 0.000 | 0.102 | 0.233 | 0.420 | 0.000 | ||
| 1 spectrum, ACLISR | 0.000 | 0.000 | 0.000 | 0.000 | 0.171 | 0.357 | 0.472 | 0.000 | ||
| 2 spectra, EGEHMLSK | 0.000 | 0.000 | 0.000 | 0.085 | 0.087 | 0.294 | 0.535 | 0.000 | ||
| 2 spectra, VTSTEFISLR | 0.000 | 0.000 | 0.000 | 0.000 | 0.200 | 0.255 | 0.545 | 0.000 | ||
| 2 spectra, FQEVFR | 0.000 | 0.014 | 0.056 | 0.000 | 0.025 | 0.497 | 0.409 | 0.000 | ||
| 1 spectrum, LHSVLKPQVQK | 0.000 | 0.000 | 0.000 | 0.068 | 0.147 | 0.333 | 0.452 | 0.000 | ||
| 2 spectra, NEDFVEIAR | 0.000 | 0.000 | 0.000 | 0.000 | 0.113 | 0.348 | 0.538 | 0.000 |
| Plot | Mito | Lyso or Perox | ER | Golgi | PM | Cytosol | Nucleus | ||||||
| Expt B |
3 peptides |
3 spectra |
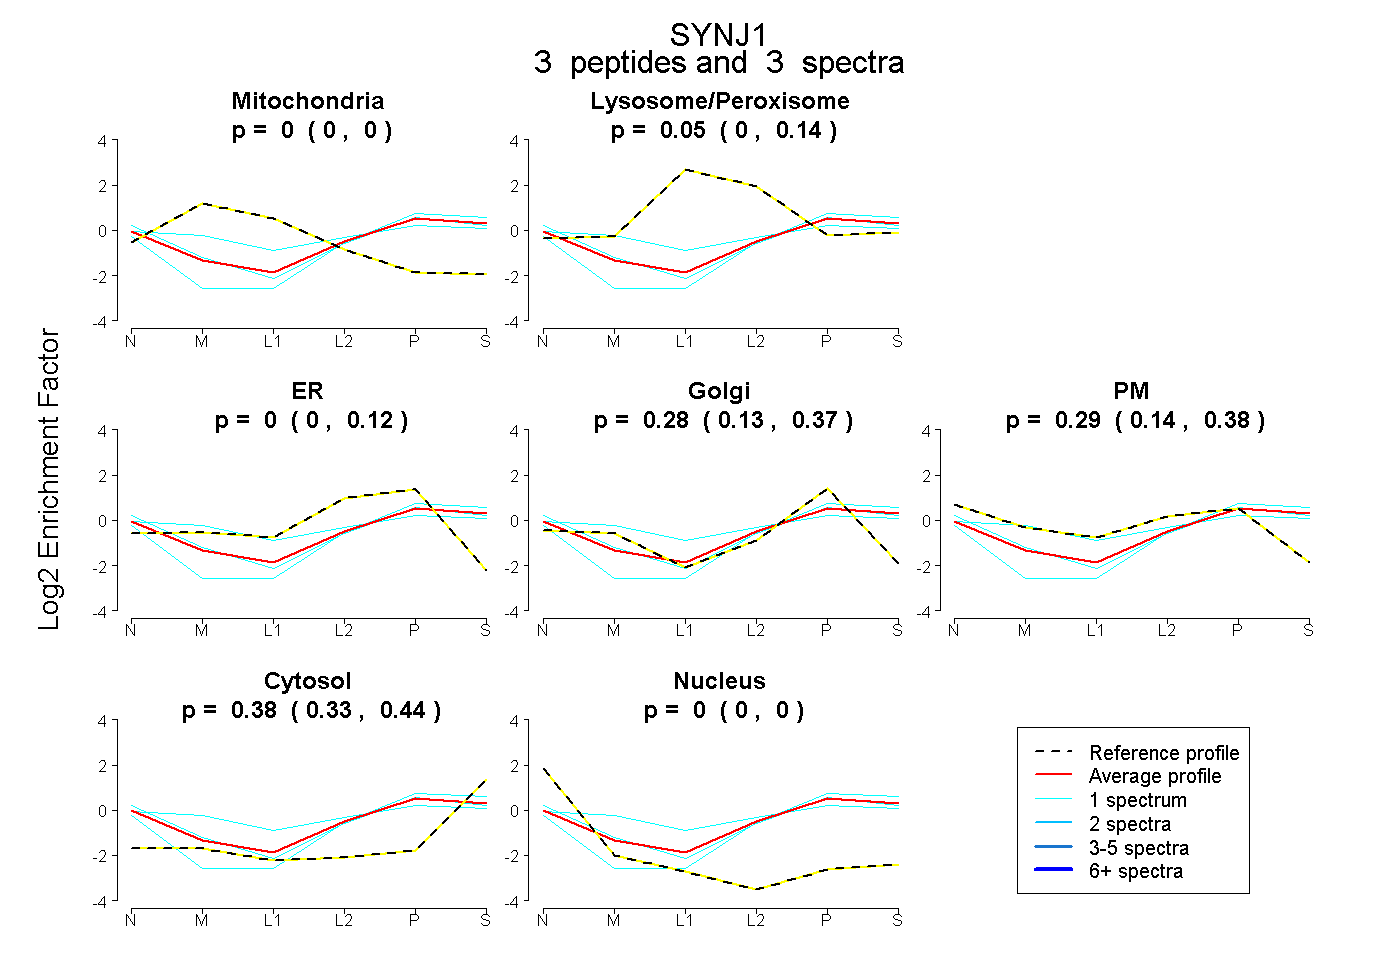 |
0.000 0.000 | 0.000 |
0.051 0.000 | 0.137 |
0.000 0.000 | 0.124 |
0.278 0.130 | 0.371 |
0.288 0.140 | 0.378 |
0.383 0.326 | 0.442 |
0.000 0.000 | 0.000 |
|||
| Plot | Lyso | Other | |||||||||||
| Expt C |
6 peptides |
7 spectra |
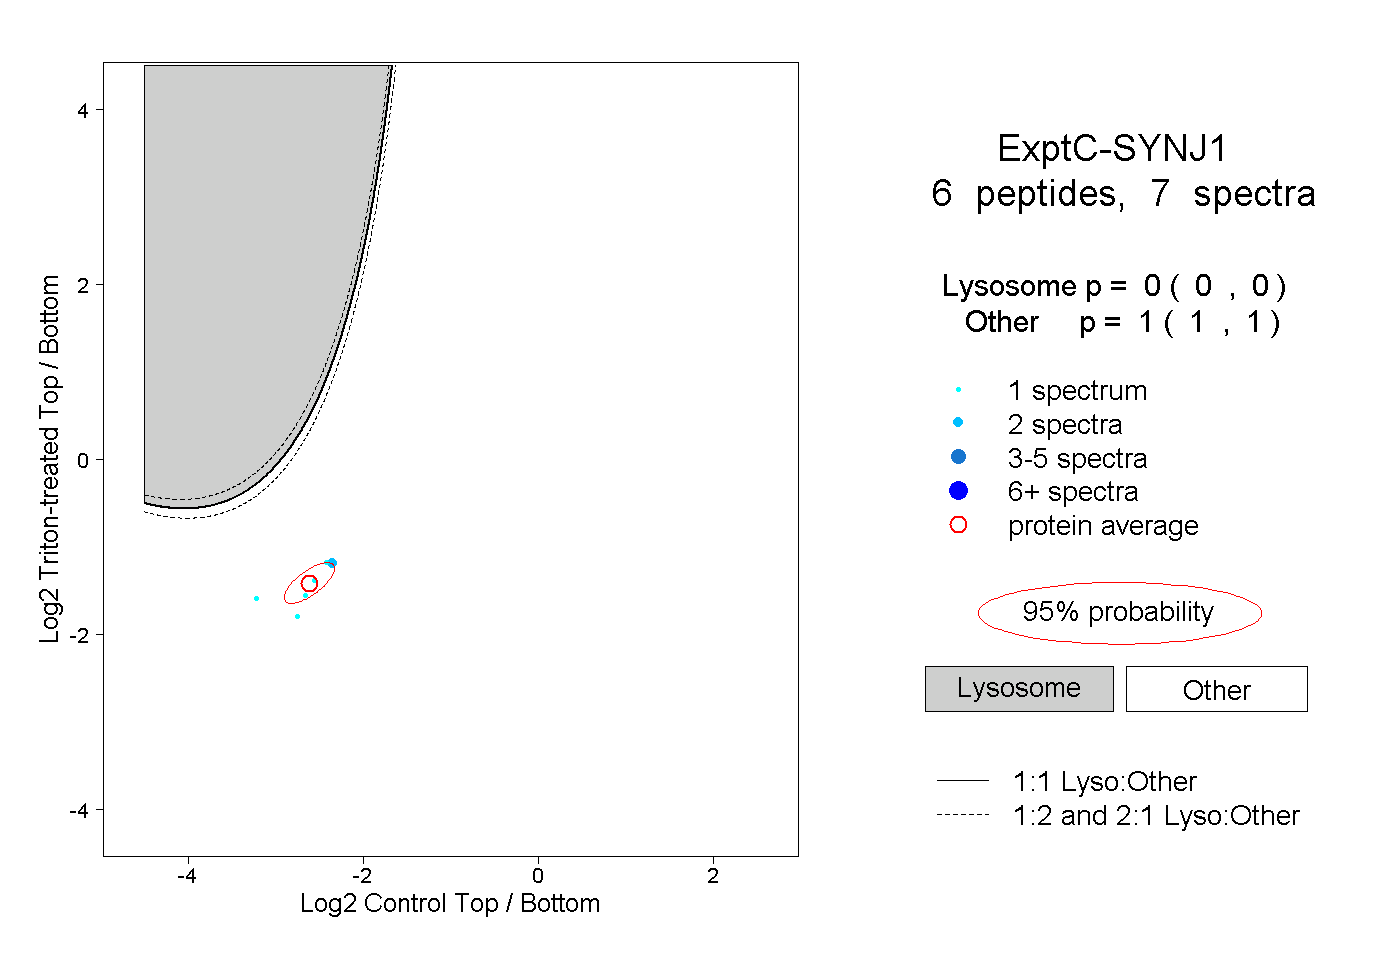 |
0.000 0.000 | 0.000 |
1.000 1.000 | 1.000 |