 4
4peptides
spectra
0.000 | 0.063
0.000 | 0.000
0.000 | 0.000
0.044 | 0.758
0.012 | 0.454
0.000 | 0.513
0.000 | 0.000
0.000 | 0.099
2peptides
spectra
NA | NA
NA | NA
| Plot | Mito | Lyso | Perox | ER | Golgi | PM | Cytosol | Nucleus | |||||
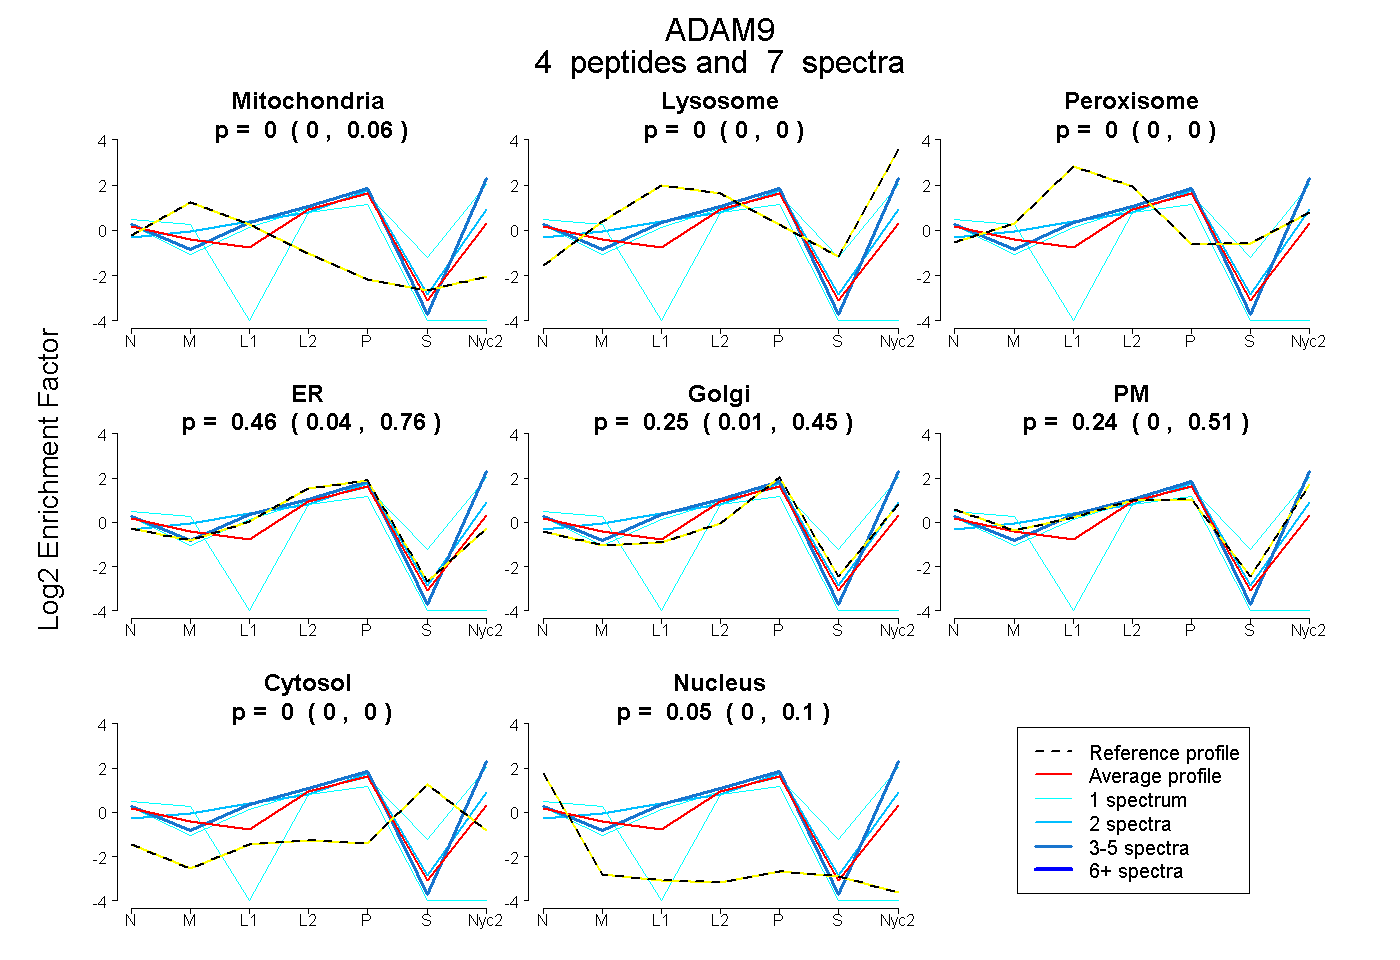
| Expt A |
4 peptides |
7 spectra |
|
0.002 0.000 | 0.063 |
0.000 0.000 | 0.000 |
0.000 0.000 | 0.000 |
0.464 0.044 | 0.758 |
0.249 0.012 | 0.454 |
0.238 0.000 | 0.513 |
0.000 0.000 | 0.000 |
0.047 0.000 | 0.099 |
||
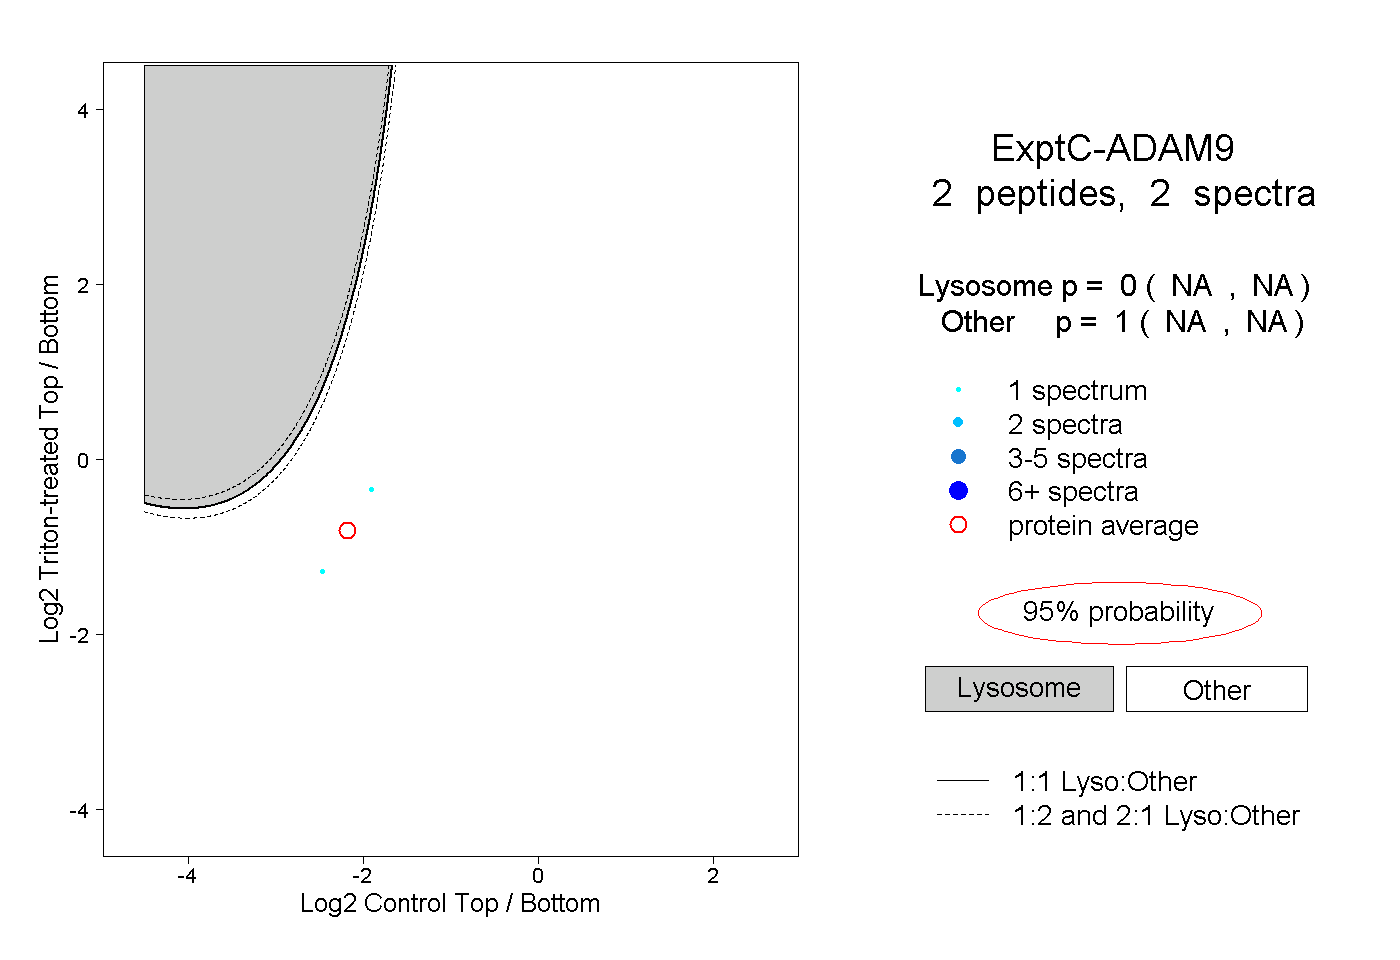
| Plot | Lyso | Other | |||||||||||
| Expt C |
2 peptides |
2 spectra |
|
0.000 NA | NA |
1.000 NA | NA |