 4
4peptides
spectra
0.000 | 0.063
0.000 | 0.000
0.000 | 0.000
0.044 | 0.758
0.012 | 0.454
0.000 | 0.513
0.000 | 0.000
0.000 | 0.099
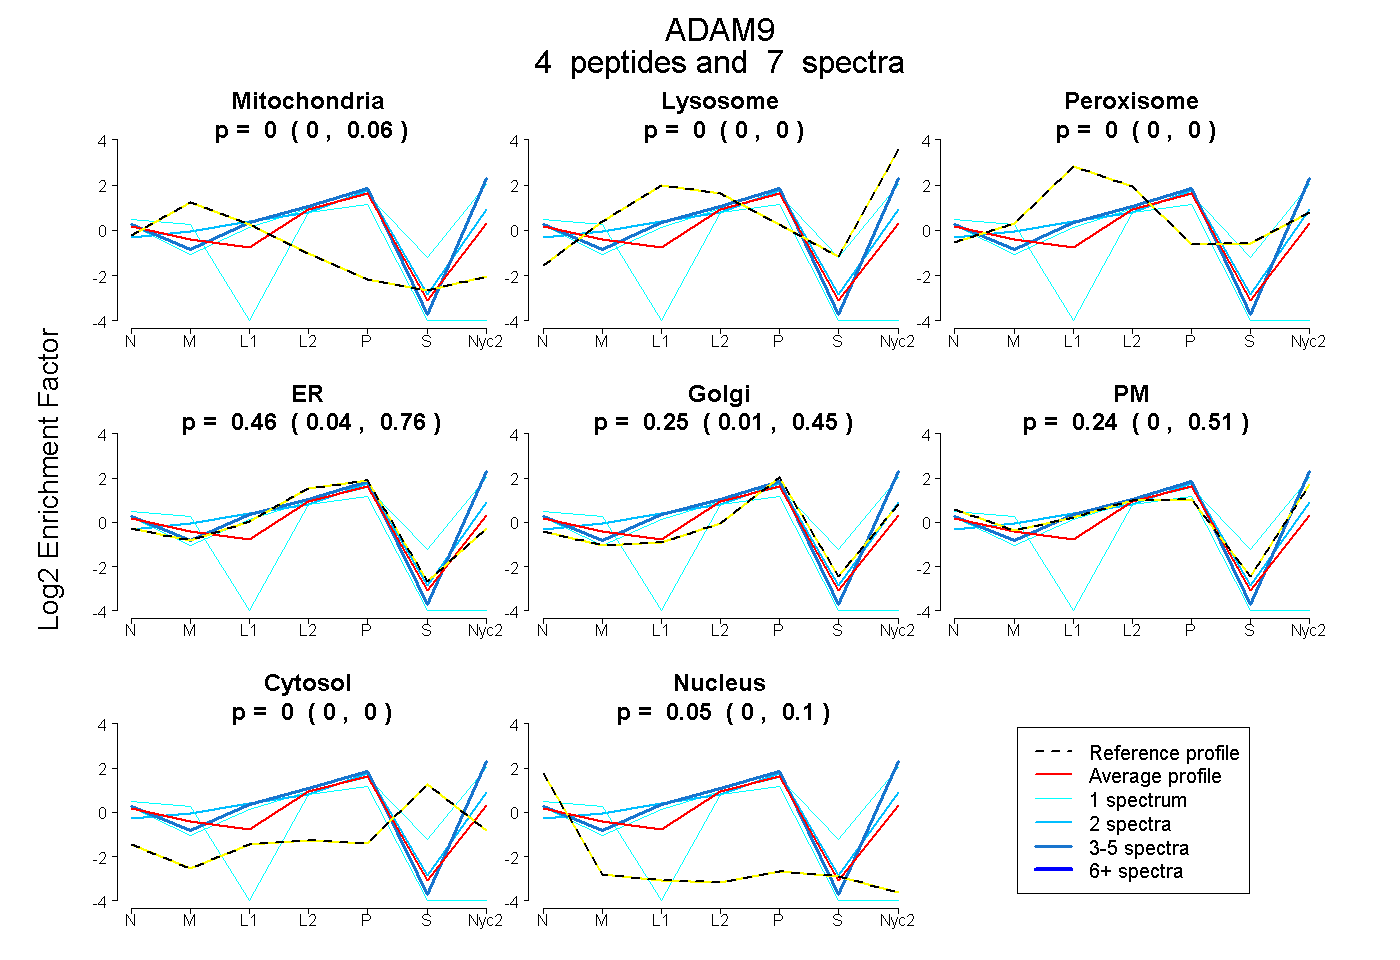
| Plot | Mito | Lyso | Perox | ER | Golgi | PM | Cytosol | Nucleus | |||||
| Expt A |
4 peptides |
7 spectra |
|
0.002 0.000 | 0.063 |
0.000 0.000 | 0.000 |
0.000 0.000 | 0.000 |
0.464 0.044 | 0.758 |
0.249 0.012 | 0.454 |
0.238 0.000 | 0.513 |
0.000 0.000 | 0.000 |
0.047 0.000 | 0.099 |
| 3 spectra, SCIMNSGASGSR | 0.000 | 0.000 | 0.000 | 0.000 | 0.106 | 0.894 | 0.000 | 0.000 | ||
| 1 spectrum, LVDPGEECDCGTPK | 0.000 | 0.000 | 0.000 | 0.558 | 0.000 | 0.000 | 0.000 | 0.442 | ||
| 2 spectra, ECELDPCCEGSTCK | 0.028 | 0.119 | 0.000 | 0.394 | 0.200 | 0.259 | 0.000 | 0.000 | ||
| 1 spectrum, AVLPQTR | 0.000 | 0.181 | 0.000 | 0.000 | 0.235 | 0.512 | 0.072 | 0.000 |
| Plot | Lyso | Other | |||||||||||
| Expt C |
2 peptides |
2 spectra |
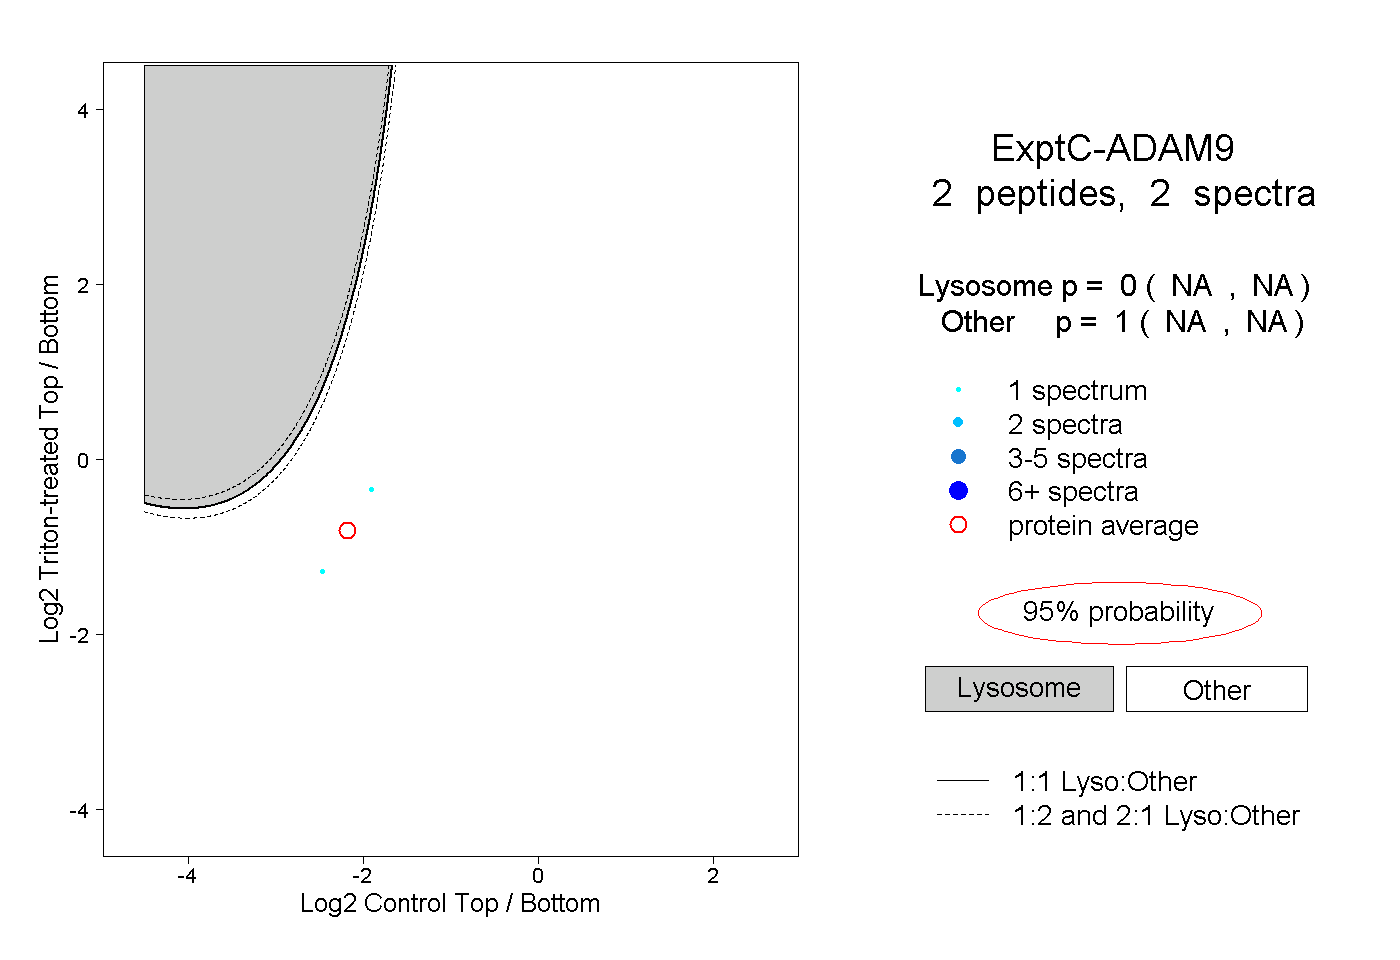 |
0.000 NA | NA |
1.000 NA | NA |