 5
5peptides
spectra
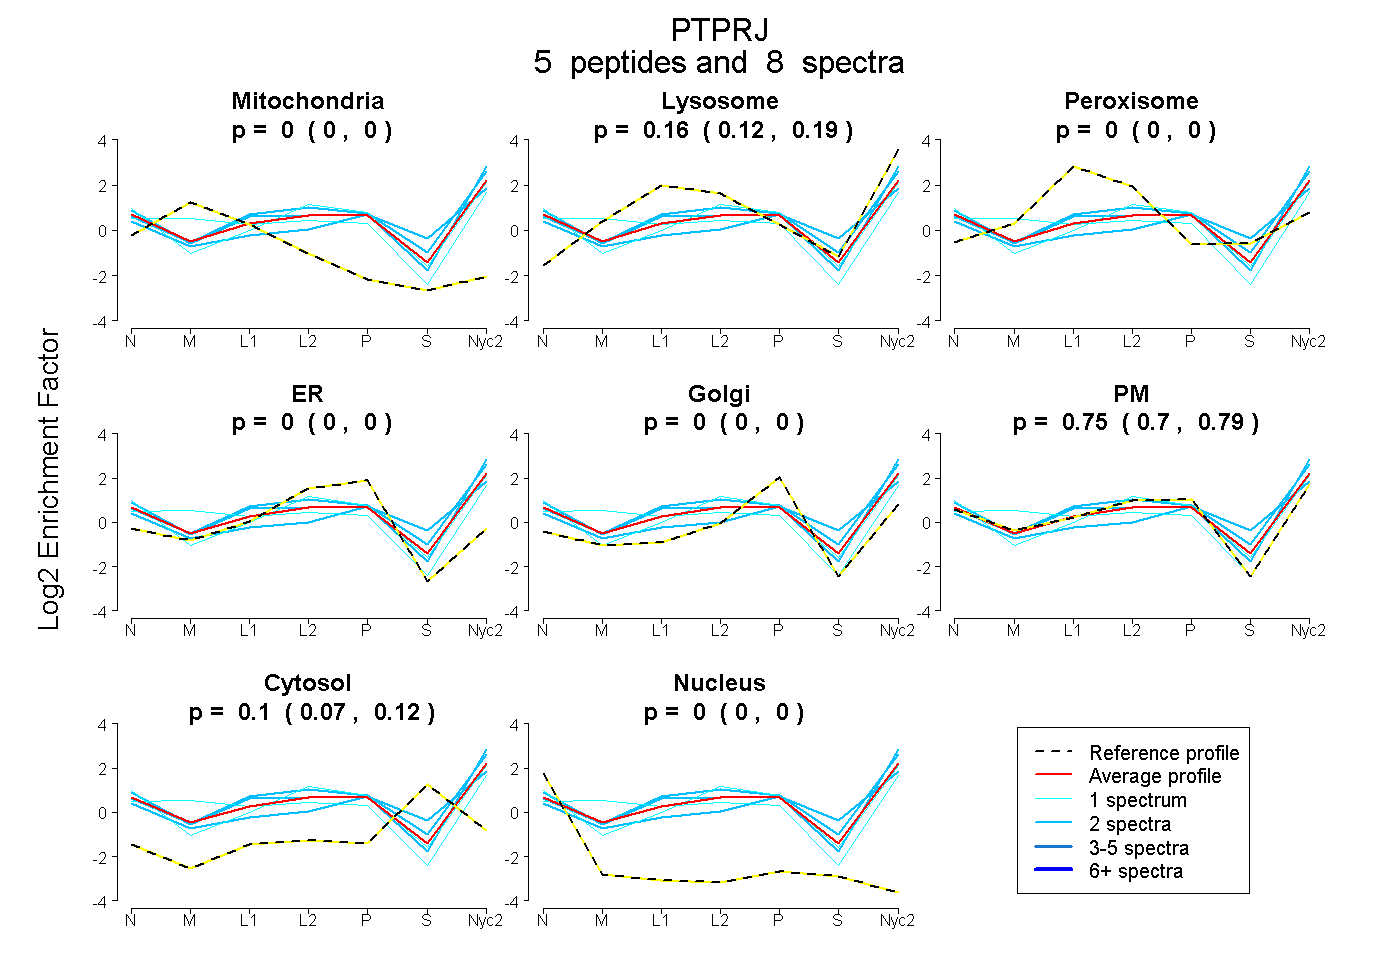
0.000 | 0.000
0.117 | 0.187
0.000 | 0.000
0.000 | 0.000
0.000 | 0.000
0.702 | 0.790
0.069 | 0.117
0.000 | 0.000
1peptide
spectrum
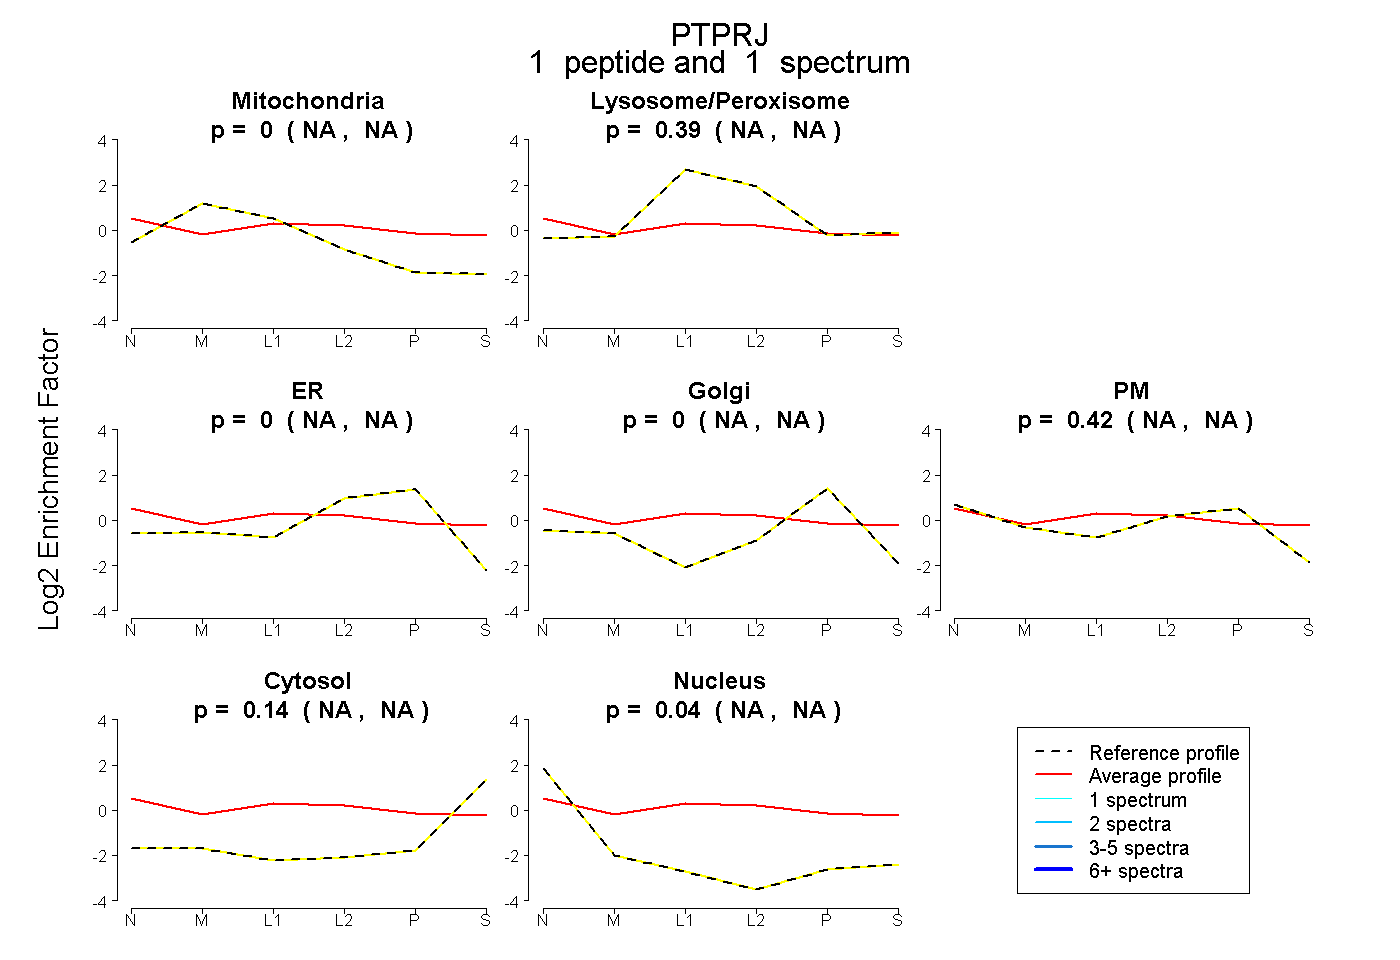
NA | NA
NA | NA
NA | NA
NA | NA
NA | NA
NA | NA
NA | NA
8peptides
spectra

0.000 | 0.289
0.692 | 1.000
3peptides
spectra
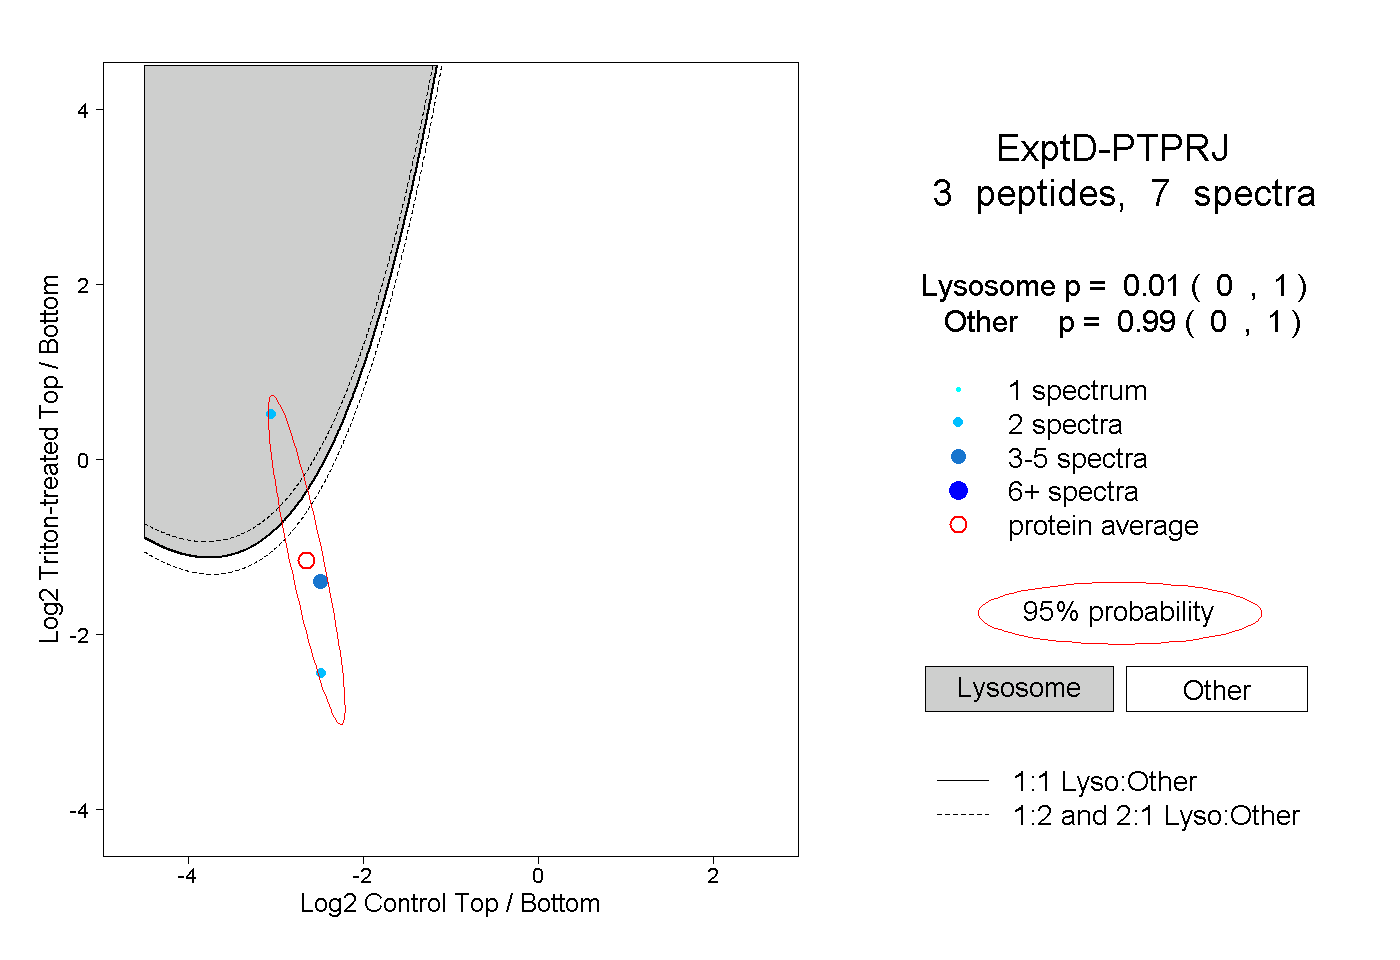
0.000 | 1.000
0.000 | 1.000