 5
5peptides
spectra
0.000 | 0.000
0.117 | 0.187
0.000 | 0.000
0.000 | 0.000
0.000 | 0.000
0.702 | 0.790
0.069 | 0.117
0.000 | 0.000
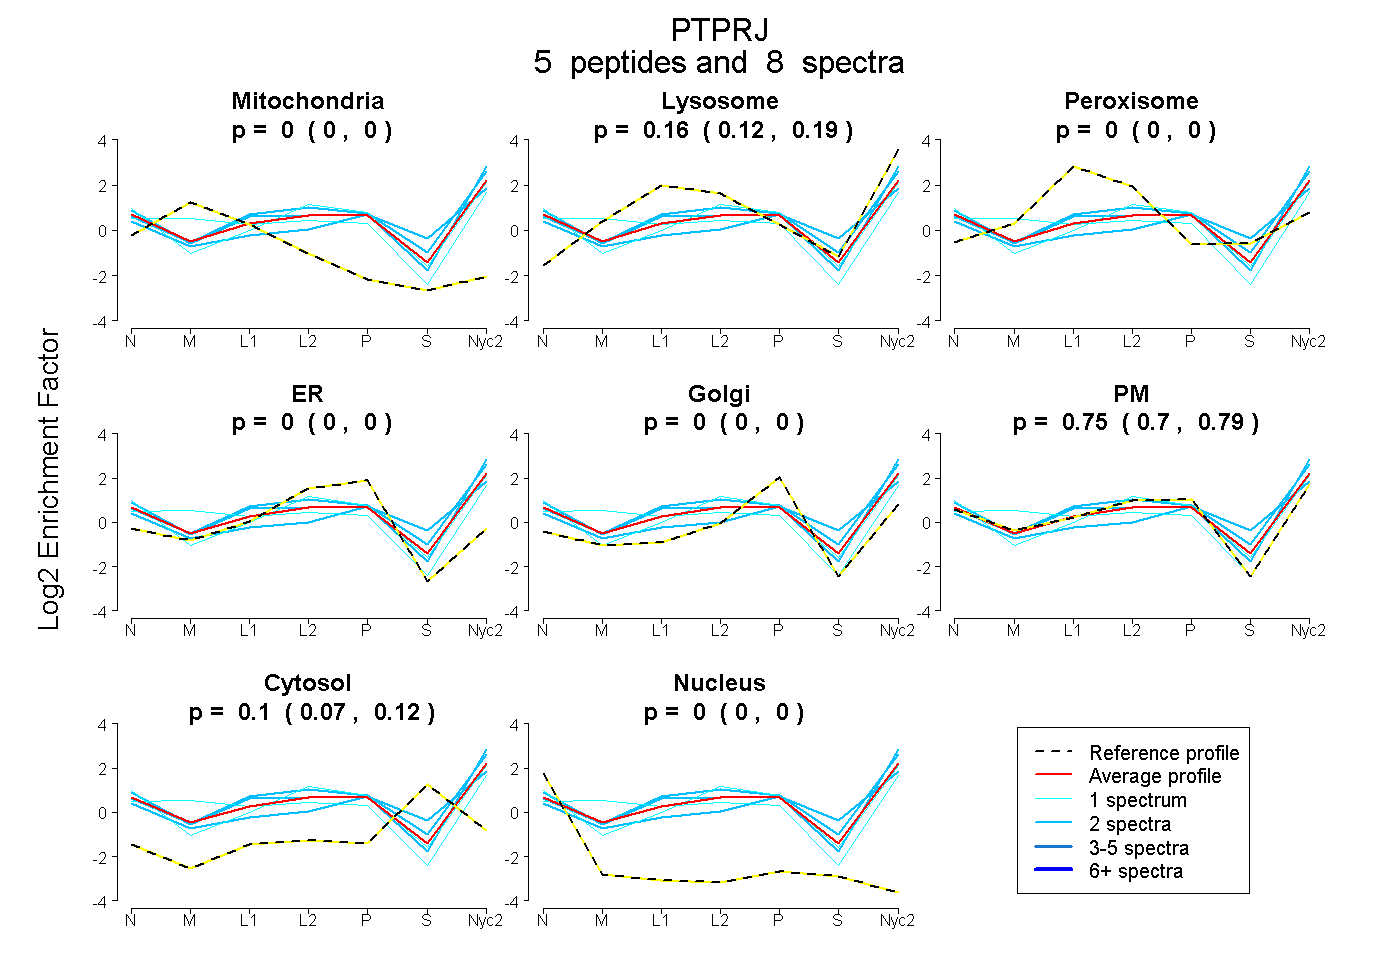
| Plot | Mito | Lyso | Perox | ER | Golgi | PM | Cytosol | Nucleus | |||||
| Expt A |
5 peptides |
8 spectra |
|
0.000 0.000 | 0.000 |
0.156 0.117 | 0.187 |
0.000 0.000 | 0.000 |
0.000 0.000 | 0.000 |
0.000 0.000 | 0.000 |
0.747 0.702 | 0.790 |
0.097 0.069 | 0.117 |
0.000 0.000 | 0.000 |
| 1 spectrum, VENFEAYFK | 0.000 | 0.035 | 0.000 | 0.000 | 0.000 | 0.886 | 0.079 | 0.000 | ||
| 2 spectra, GASDTYVTYLIR | 0.000 | 0.204 | 0.000 | 0.000 | 0.000 | 0.791 | 0.005 | 0.000 | ||
| 2 spectra, FSGFEASHGPIK | 0.000 | 0.319 | 0.000 | 0.000 | 0.000 | 0.610 | 0.071 | 0.000 | ||
| 1 spectrum, TGTFIALDR | 0.174 | 0.118 | 0.000 | 0.000 | 0.000 | 0.708 | 0.000 | 0.000 | ||
| 2 spectra, EPALVLK | 0.000 | 0.134 | 0.000 | 0.000 | 0.000 | 0.581 | 0.285 | 0.000 |
| Plot | Mito | Lyso or Perox | ER | Golgi | PM | Cytosol | Nucleus | ||||||
| Expt B |
1 peptide |
1 spectrum |
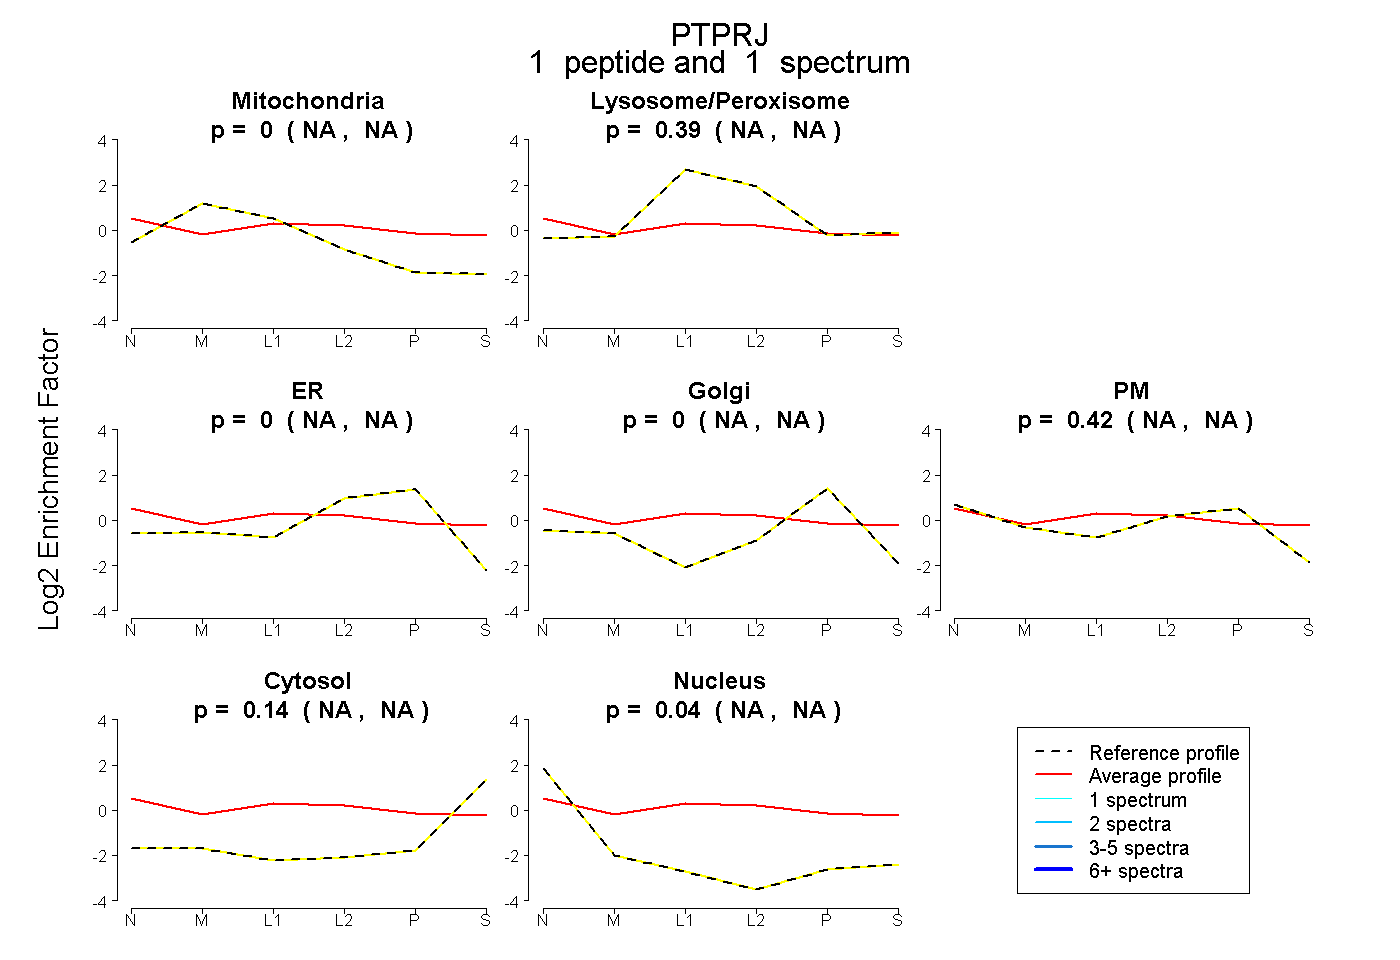 |
0.000 NA | NA |
0.392 NA | NA |
0.000 NA | NA |
0.000 NA | NA |
0.421 NA | NA |
0.143 NA | NA |
0.044 NA | NA |
|||
| Plot | Lyso | Other | |||||||||||
| Expt C |
8 peptides |
15 spectra |
 |
0.000 0.000 | 0.289 |
1.000 0.692 | 1.000 |
||||||||
| Plot | Lyso | Other | |||||||||||
| Expt D |
3 peptides |
7 spectra |
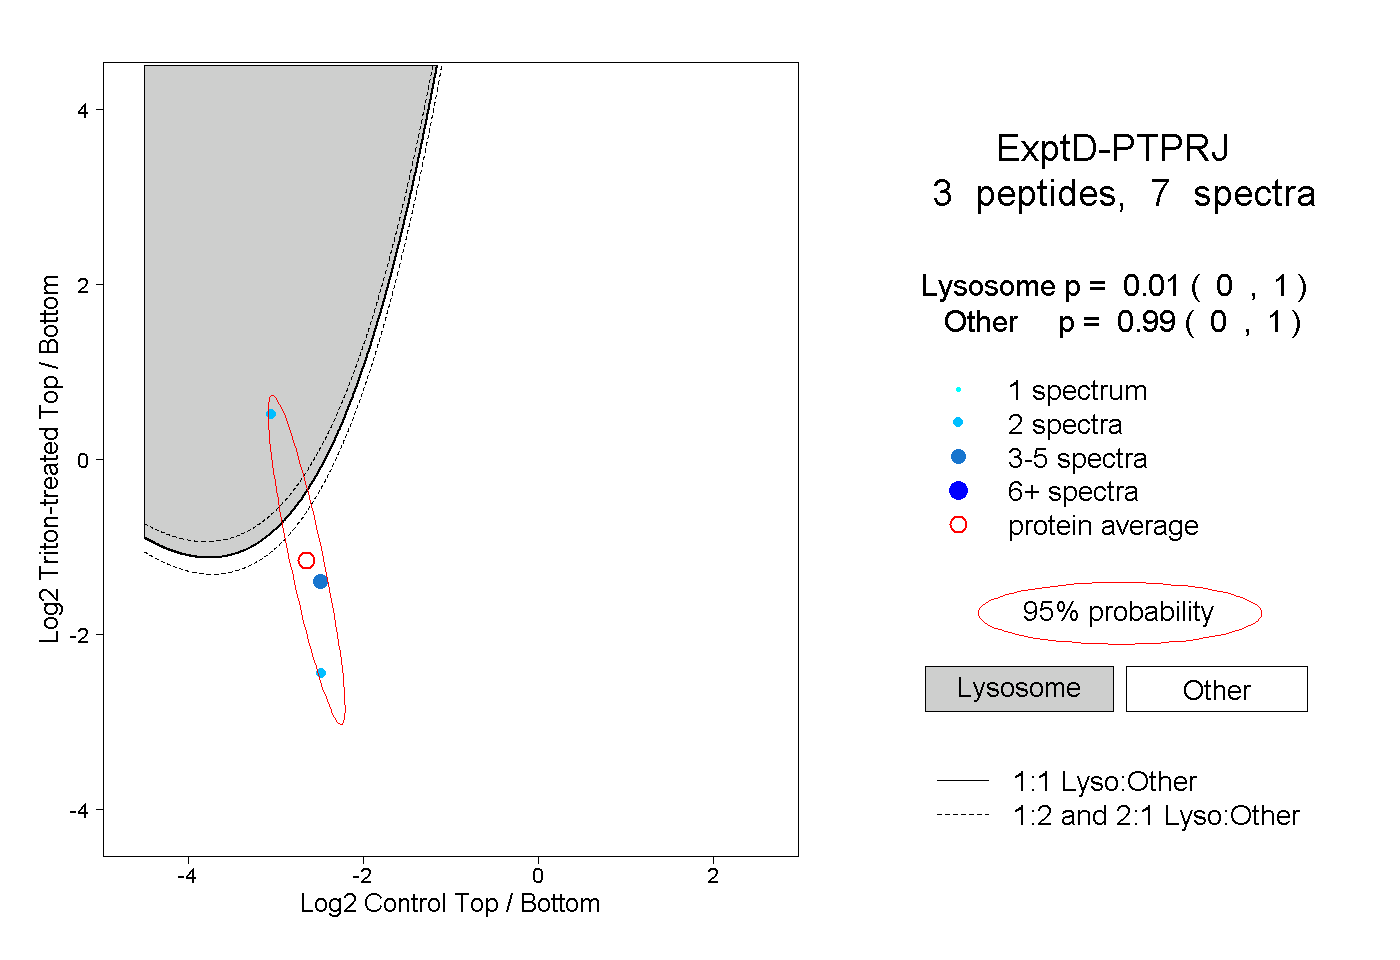 |
0.010 0.000 | 1.000 |
0.990 0.000 | 1.000 |