 22
22peptides
spectra
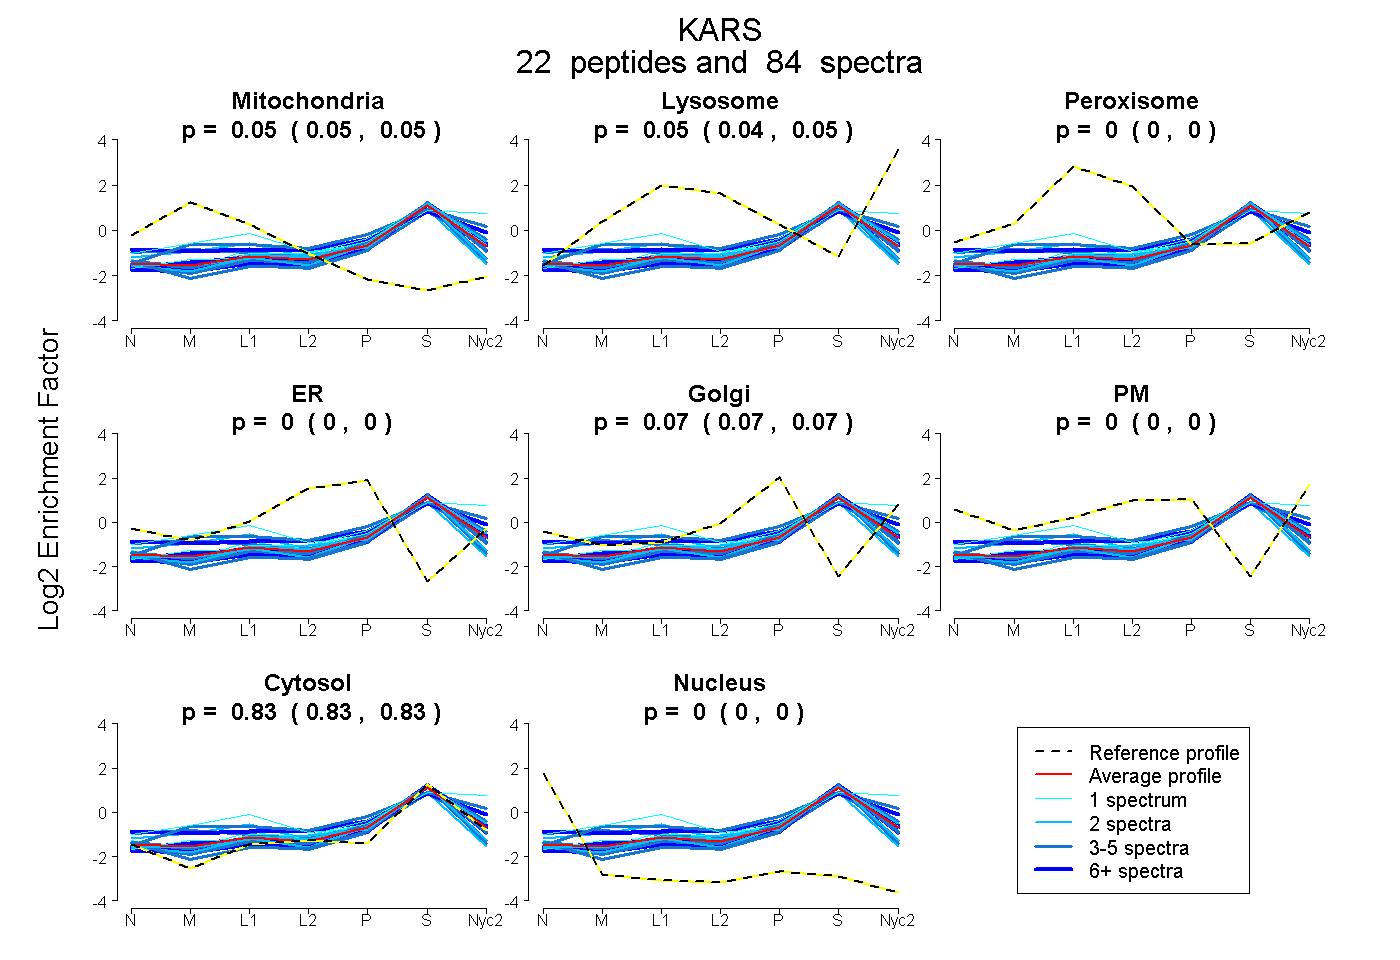
0.047 | 0.053
0.045 | 0.051
0.000 | 0.000
0.000 | 0.000
0.070 | 0.075
0.000 | 0.000
0.826 | 0.831
0.000 | 0.000
15peptides
spectra
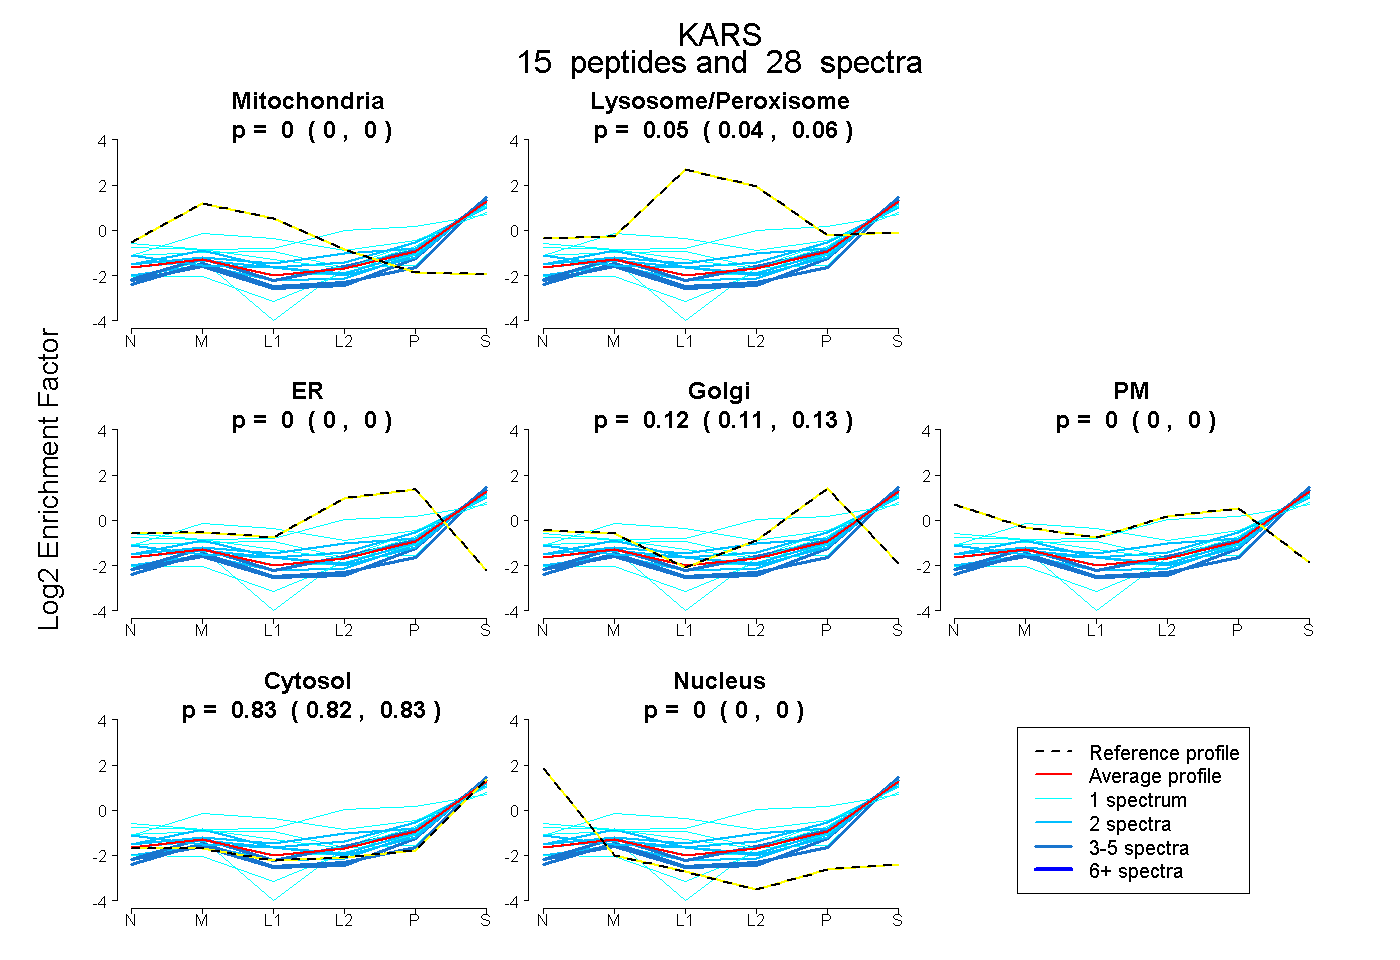
0.000 | 0.000
0.041 | 0.061
0.000 | 0.000
0.111 | 0.130
0.000 | 0.000
0.819 | 0.833
0.000 | 0.000
21peptides
spectra

0.000 | 0.000
1.000 | 1.000
3peptides
spectra
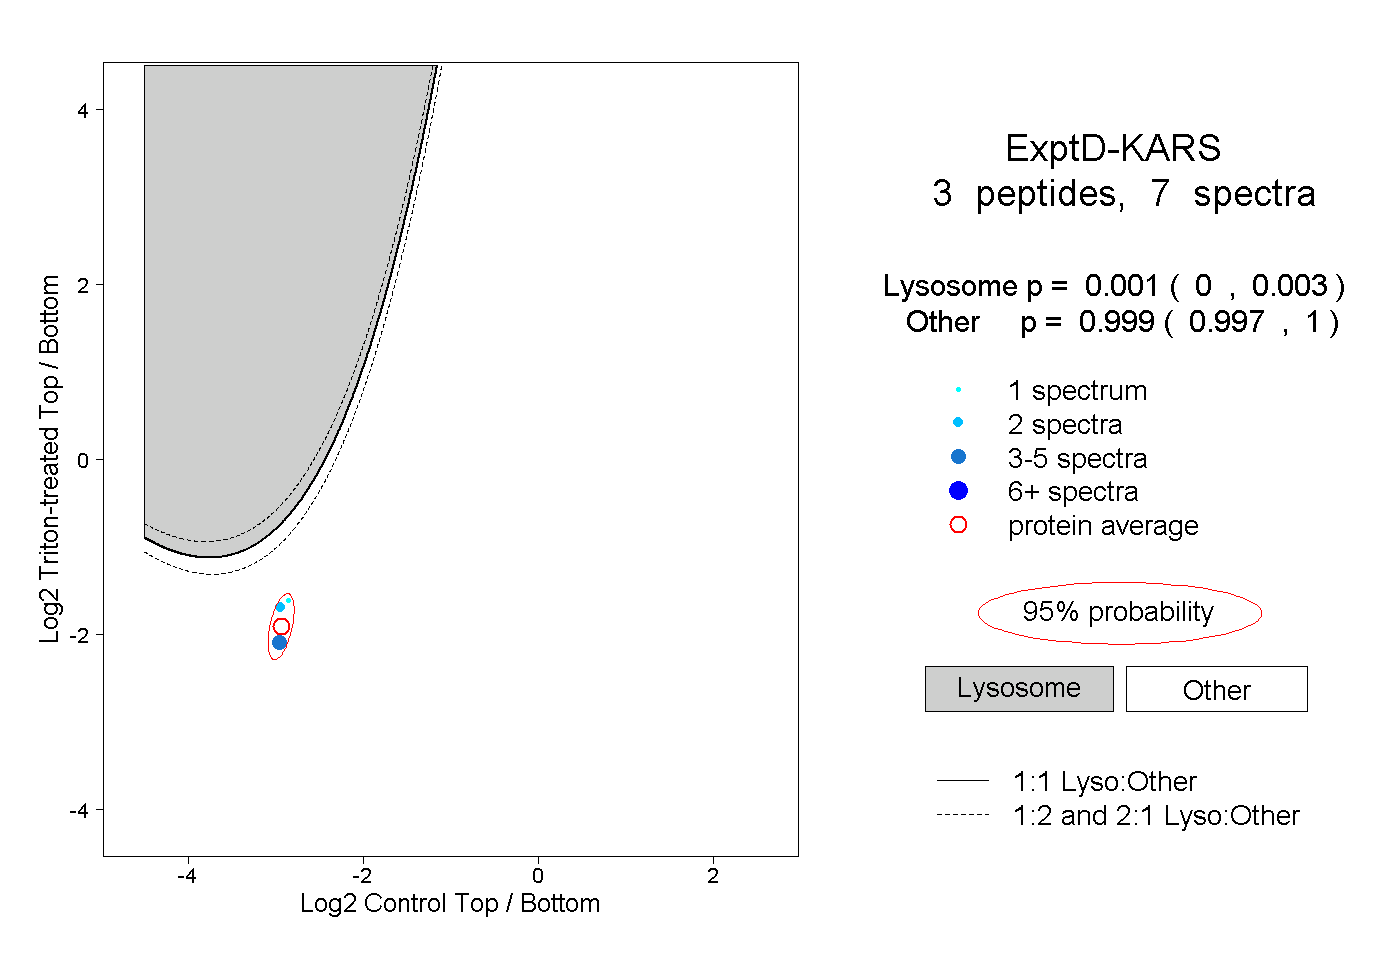
0.000 | 0.003
0.997 | 1.000