 22
22peptides
spectra
0.047 | 0.053
0.045 | 0.051
0.000 | 0.000
0.000 | 0.000
0.070 | 0.075
0.000 | 0.000
0.826 | 0.831
0.000 | 0.000
| Plot | Mito | Lyso | Perox | ER | Golgi | PM | Cytosol | Nucleus | |||||
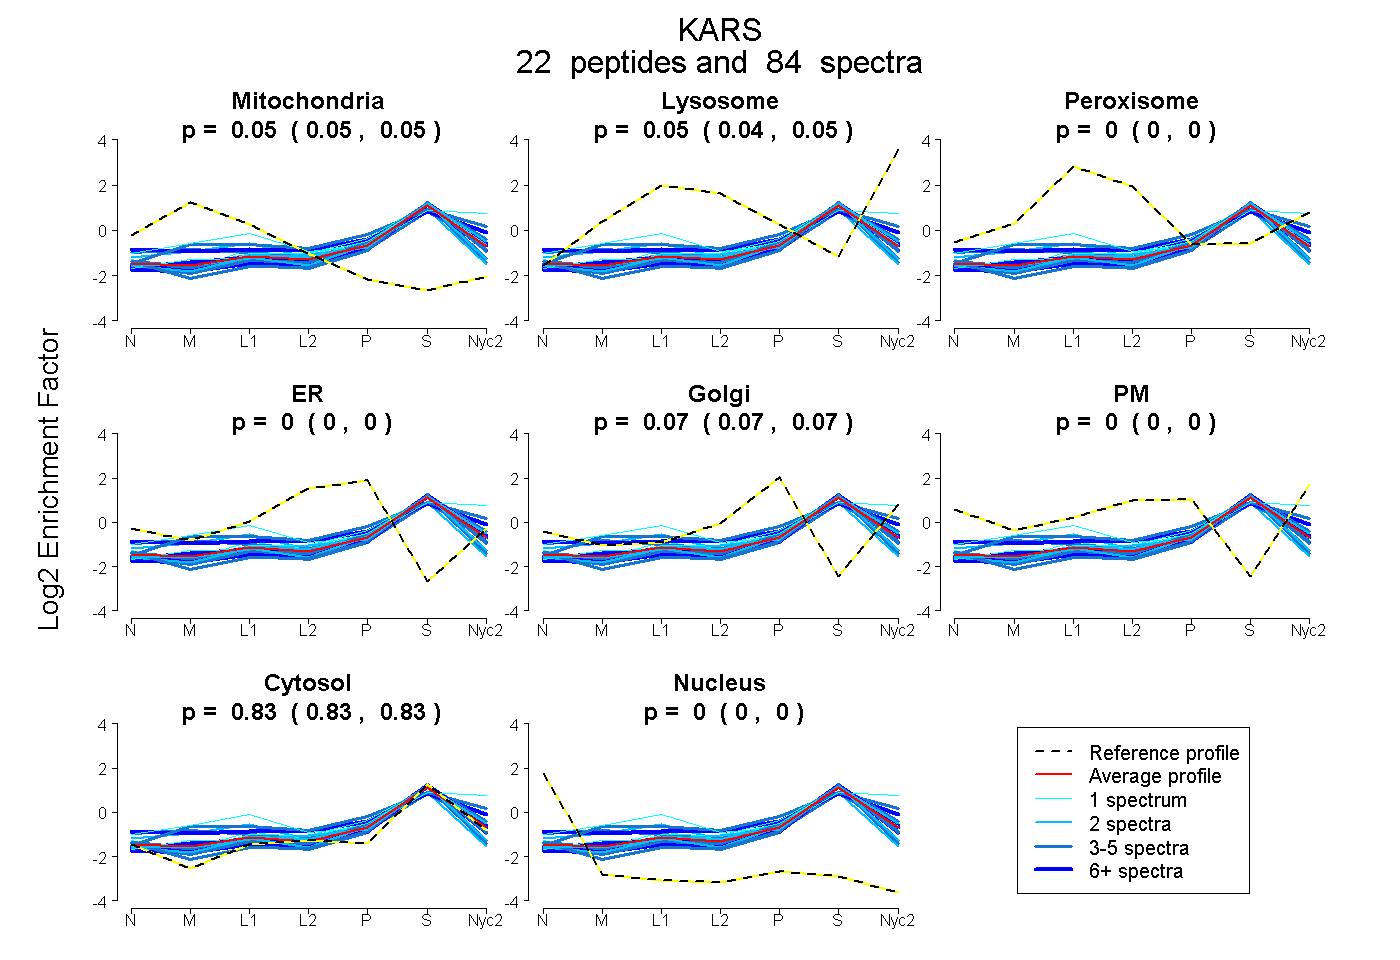
| Expt A |
22 peptides |
84 spectra |
|
0.050 0.047 | 0.053 |
0.048 0.045 | 0.051 |
0.000 0.000 | 0.000 |
0.000 0.000 | 0.000 |
0.073 0.070 | 0.075 |
0.000 0.000 | 0.000 |
0.829 0.826 | 0.831 |
0.000 0.000 | 0.000 |
| 4 spectra, VYEIGR | 0.002 | 0.000 | 0.000 | 0.000 | 0.054 | 0.000 | 0.936 | 0.008 | ||
| 2 spectra, GELSIVPR | 0.018 | 0.076 | 0.000 | 0.000 | 0.079 | 0.000 | 0.828 | 0.000 | ||
| 4 spectra, LPETSLFETEETR | 0.010 | 0.046 | 0.000 | 0.000 | 0.039 | 0.000 | 0.906 | 0.000 | ||
| 2 spectra, VSGEDPYPHK | 0.061 | 0.000 | 0.000 | 0.000 | 0.050 | 0.000 | 0.889 | 0.000 | ||
| 4 spectra, LLTYLR | 0.000 | 0.053 | 0.000 | 0.000 | 0.076 | 0.000 | 0.871 | 0.000 | ||
| 6 spectra, SEEEFVHINNK | 0.032 | 0.000 | 0.004 | 0.000 | 0.081 | 0.000 | 0.883 | 0.000 | ||
| 4 spectra, AVECPPPR | 0.034 | 0.000 | 0.000 | 0.085 | 0.000 | 0.000 | 0.881 | 0.000 | ||
| 1 spectrum, VTMFLTDSNNIK | 0.037 | 0.076 | 0.000 | 0.000 | 0.083 | 0.000 | 0.804 | 0.000 | ||
| 1 spectrum, EVLLFPAMKPEDK | 0.000 | 0.016 | 0.071 | 0.000 | 0.108 | 0.000 | 0.804 | 0.000 | ||
| 2 spectra, YLDLILNDFVR | 0.020 | 0.087 | 0.000 | 0.000 | 0.048 | 0.000 | 0.845 | 0.000 | ||
| 4 spectra, FELFVMK | 0.173 | 0.086 | 0.000 | 0.000 | 0.042 | 0.000 | 0.699 | 0.000 | ||
| 13 spectra, LQVMANSR | 0.073 | 0.060 | 0.000 | 0.000 | 0.019 | 0.000 | 0.848 | 0.000 | ||
| 2 spectra, EICNAYTELNDPVR | 0.191 | 0.000 | 0.067 | 0.037 | 0.000 | 0.000 | 0.705 | 0.000 | ||
| 5 spectra, MLSGMVR | 0.045 | 0.245 | 0.000 | 0.000 | 0.069 | 0.000 | 0.640 | 0.000 | ||
| 4 spectra, ILDDICVAR | 0.081 | 0.000 | 0.000 | 0.040 | 0.000 | 0.000 | 0.879 | 0.000 | ||
| 1 spectrum, SITGSYK | 0.000 | 0.000 | 0.056 | 0.006 | 0.119 | 0.000 | 0.819 | 0.000 | ||
| 3 spectra, SQAVQQLK | 0.003 | 0.000 | 0.000 | 0.000 | 0.116 | 0.000 | 0.881 | 0.000 | ||
| 1 spectrum, QLFEEQAK | 0.069 | 0.333 | 0.000 | 0.000 | 0.000 | 0.000 | 0.599 | 0.000 | ||
| 7 spectra, MLVVGGIDR | 0.000 | 0.020 | 0.000 | 0.000 | 0.086 | 0.000 | 0.895 | 0.000 | ||
| 4 spectra, IAPELYHK | 0.044 | 0.000 | 0.000 | 0.000 | 0.031 | 0.000 | 0.925 | 0.000 | ||
| 6 spectra, ISMVEELEK | 0.055 | 0.103 | 0.051 | 0.000 | 0.107 | 0.024 | 0.661 | 0.000 | ||
| 4 spectra, LIFYDLR | 0.041 | 0.000 | 0.000 | 0.000 | 0.099 | 0.000 | 0.860 | 0.000 |
| Plot | Mito | Lyso or Perox | ER | Golgi | PM | Cytosol | Nucleus | ||||||
| Expt B |
15 peptides |
28 spectra |
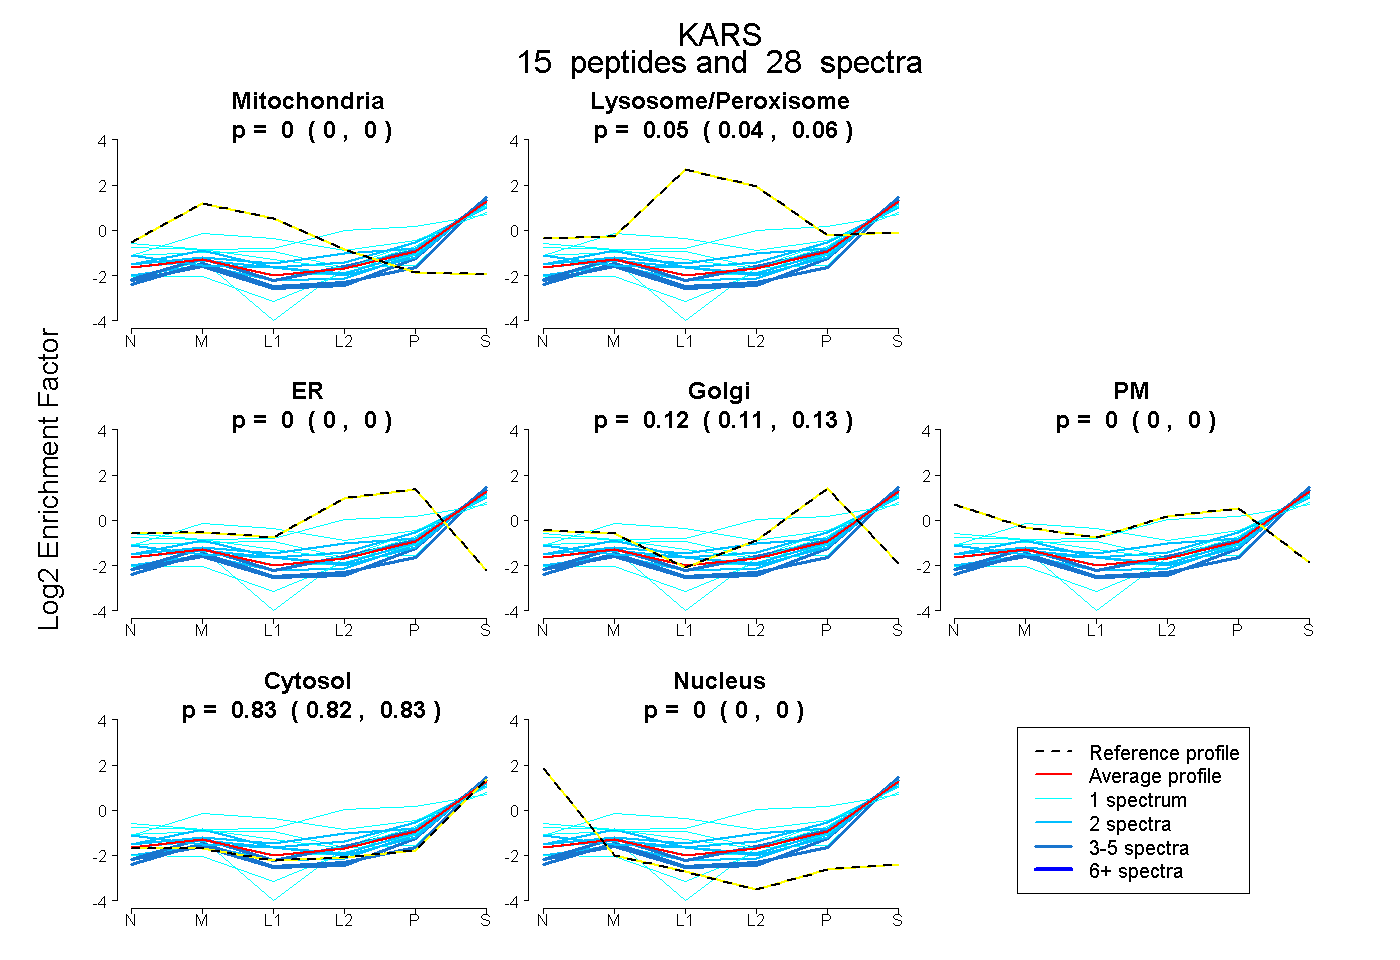 |
0.000 0.000 | 0.000 |
0.052 0.041 | 0.061 |
0.000 0.000 | 0.000 |
0.122 0.111 | 0.130 |
0.000 0.000 | 0.000 |
0.826 0.819 | 0.833 |
0.000 0.000 | 0.000 |
|||
| Plot | Lyso | Other | |||||||||||
| Expt C |
21 peptides |
111 spectra |
 |
0.000 0.000 | 0.000 |
1.000 1.000 | 1.000 |
||||||||
| Plot | Lyso | Other | |||||||||||
| Expt D |
3 peptides |
7 spectra |
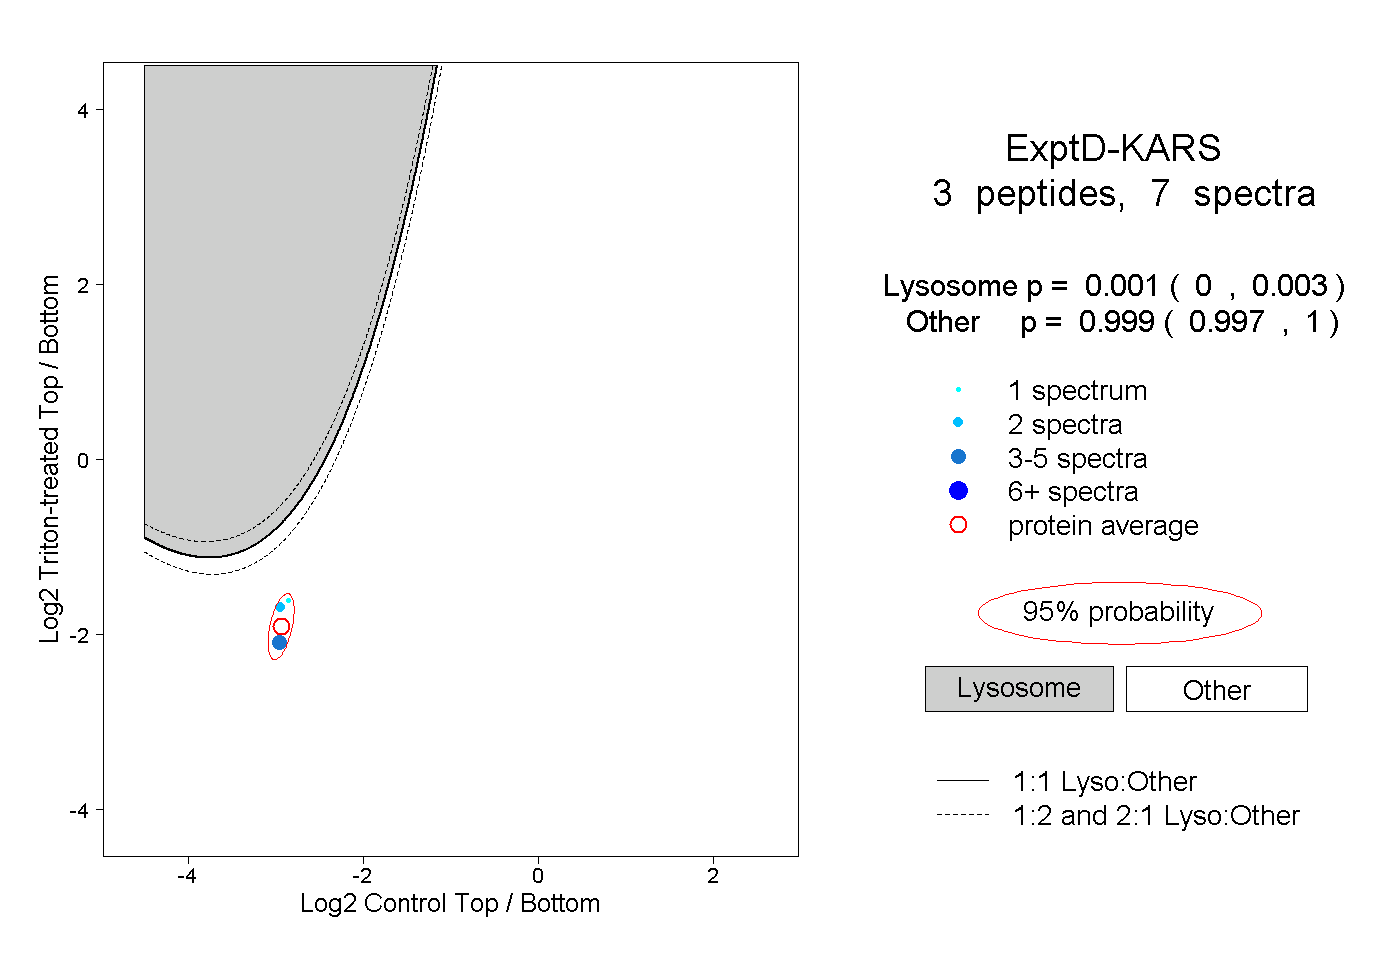 |
0.001 0.000 | 0.003 |
0.999 0.997 | 1.000 |