 12
12peptides
spectra
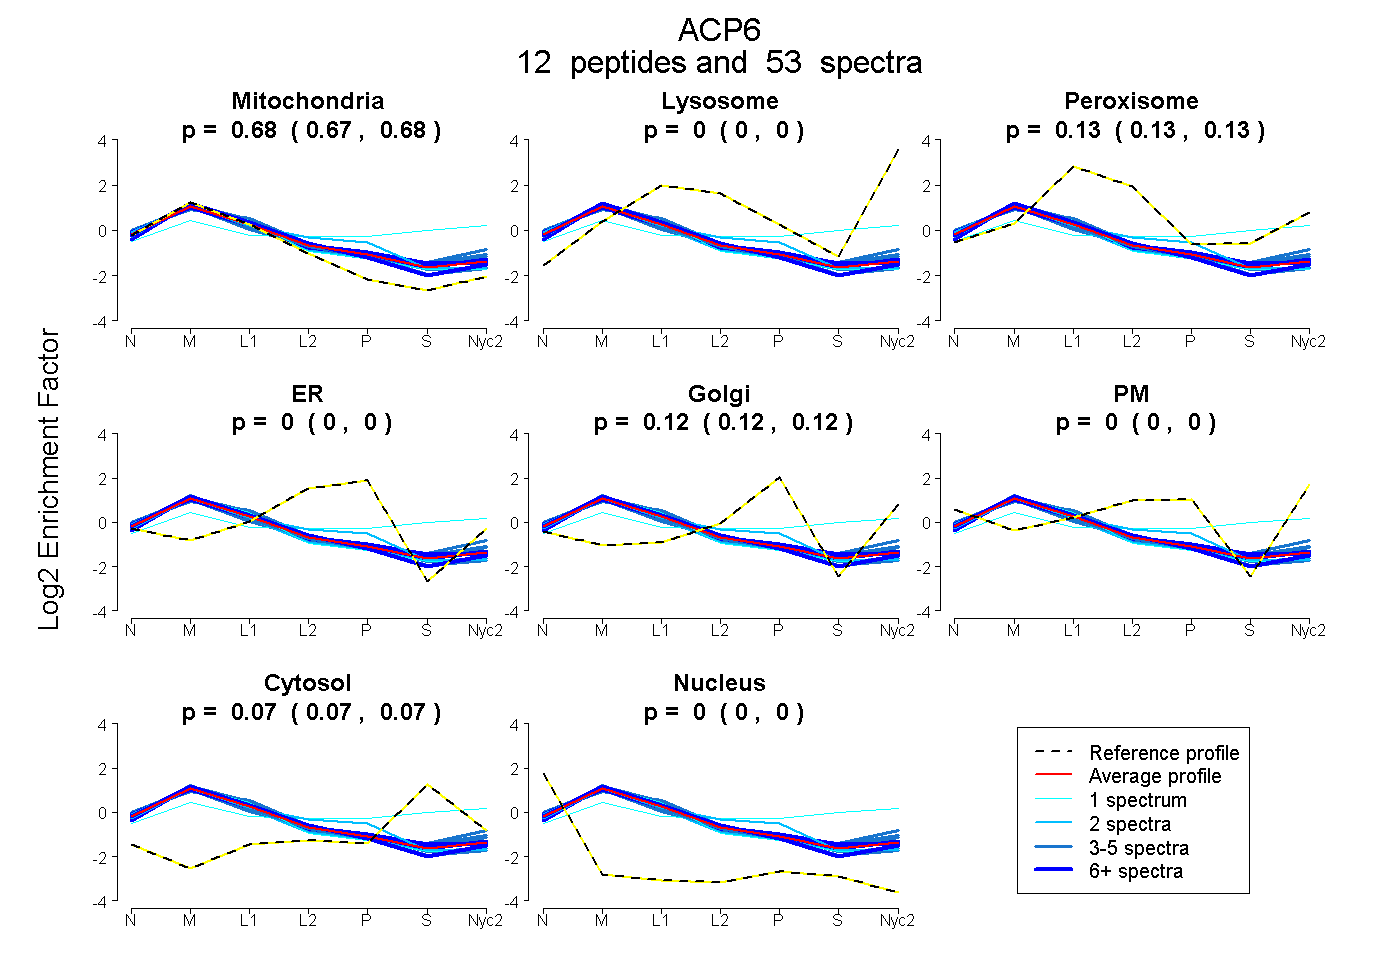
0.674 | 0.681
0.000 | 0.000
0.129 | 0.135
0.000 | 0.000
0.116 | 0.123
0.000 | 0.000
0.067 | 0.074
0.000 | 0.000
5peptides
spectra
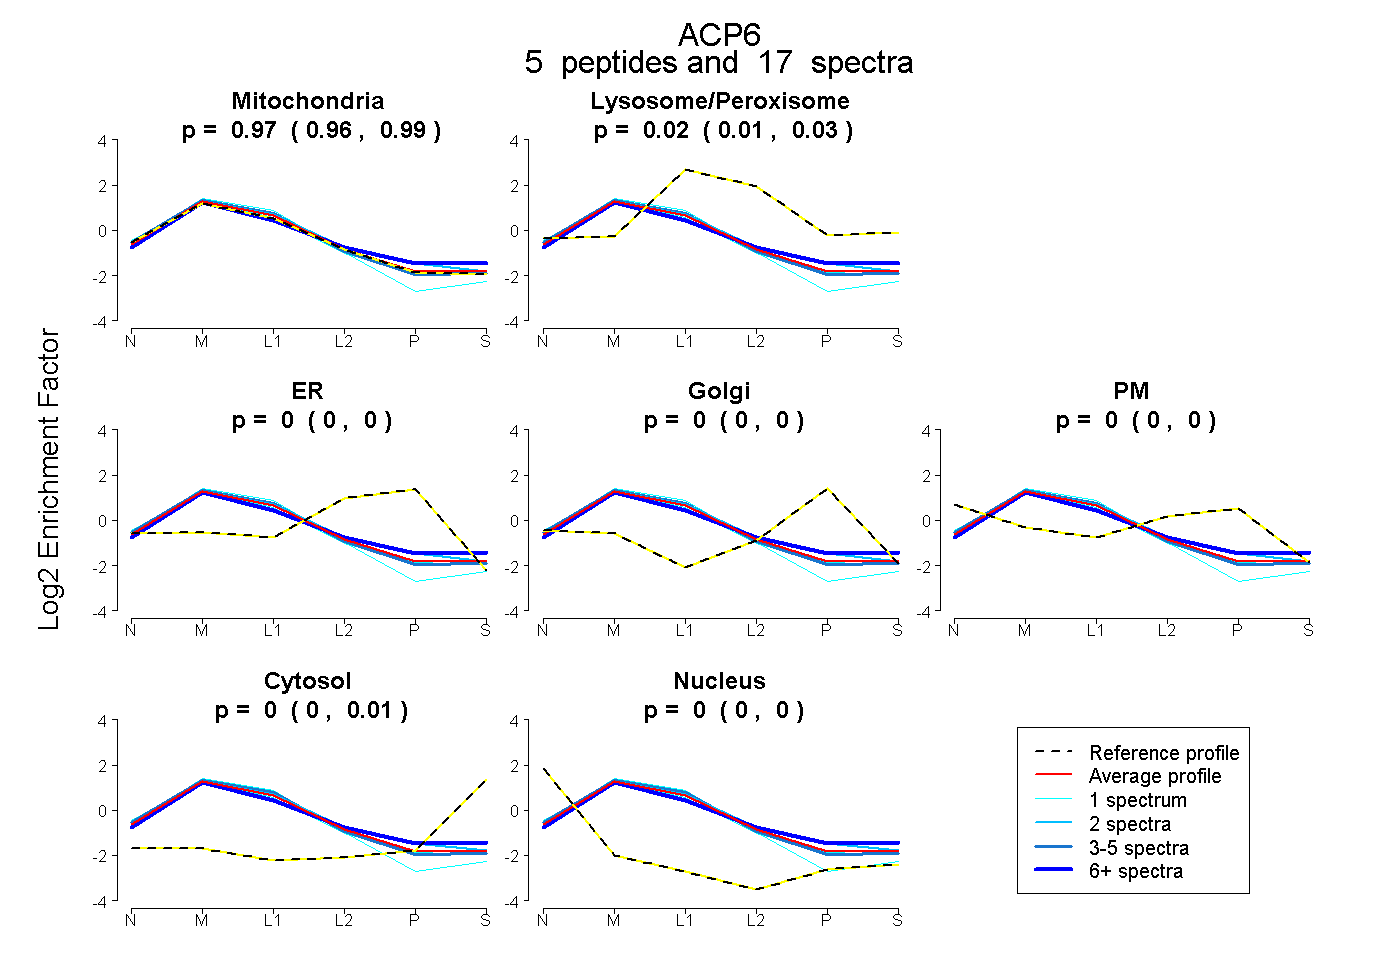
0.959 | 0.985
0.012 | 0.031
0.000 | 0.000
0.000 | 0.000
0.000 | 0.000
0.000 | 0.011
0.000 | 0.000
17peptides
spectra
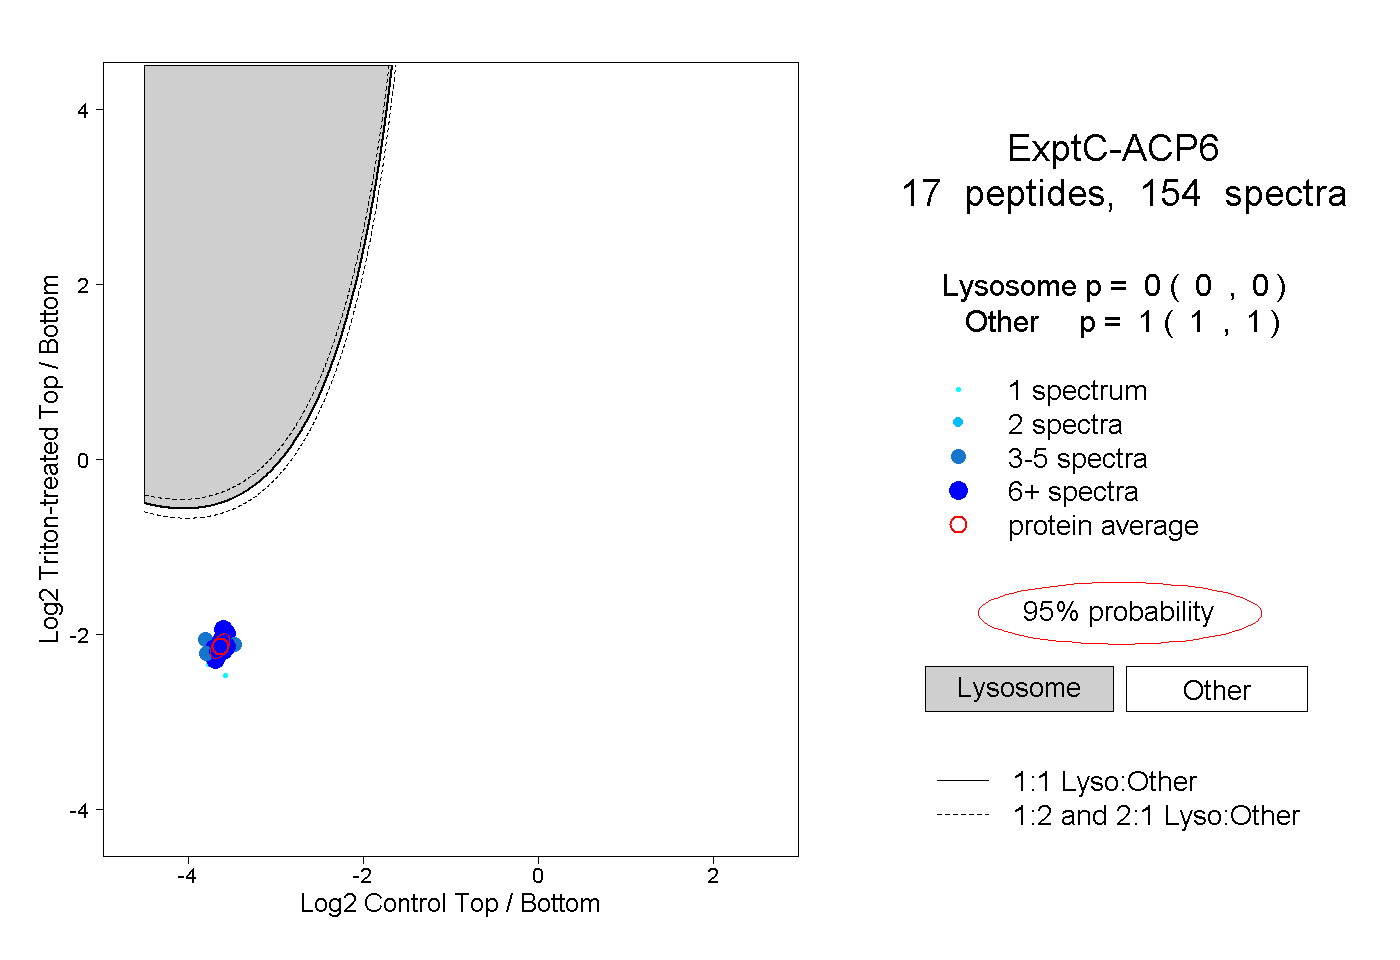
0.000 | 0.000
1.000 | 1.000
7peptides
spectra
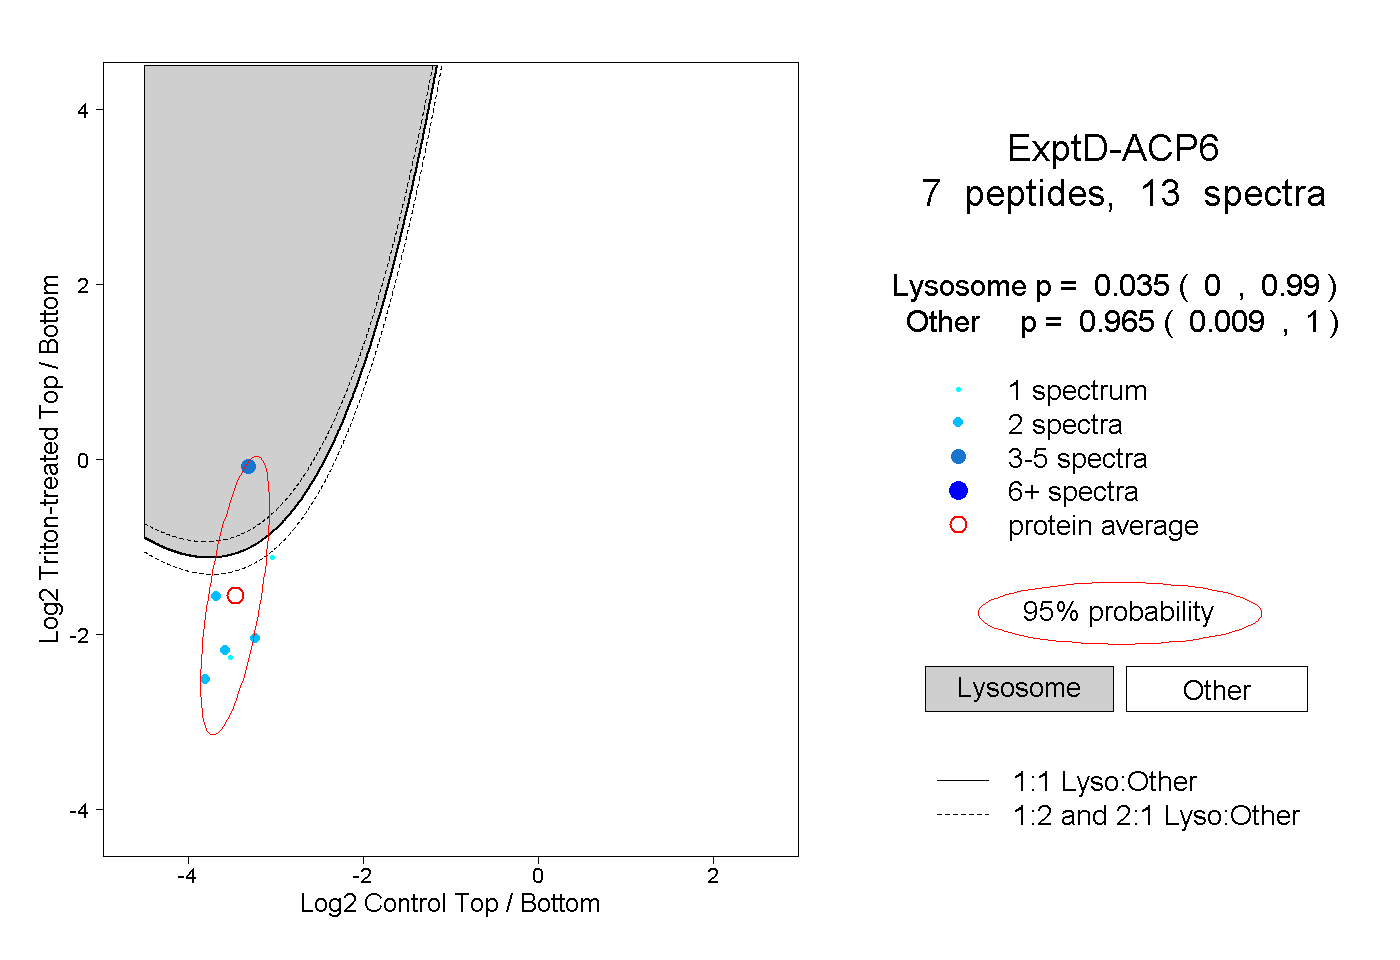
0.000 | 0.990
0.009 | 1.000