 12
12peptides
spectra
0.674 | 0.681
0.000 | 0.000
0.129 | 0.135
0.000 | 0.000
0.116 | 0.123
0.000 | 0.000
0.067 | 0.074
0.000 | 0.000
| Plot | Mito | Lyso | Perox | ER | Golgi | PM | Cytosol | Nucleus | |||||
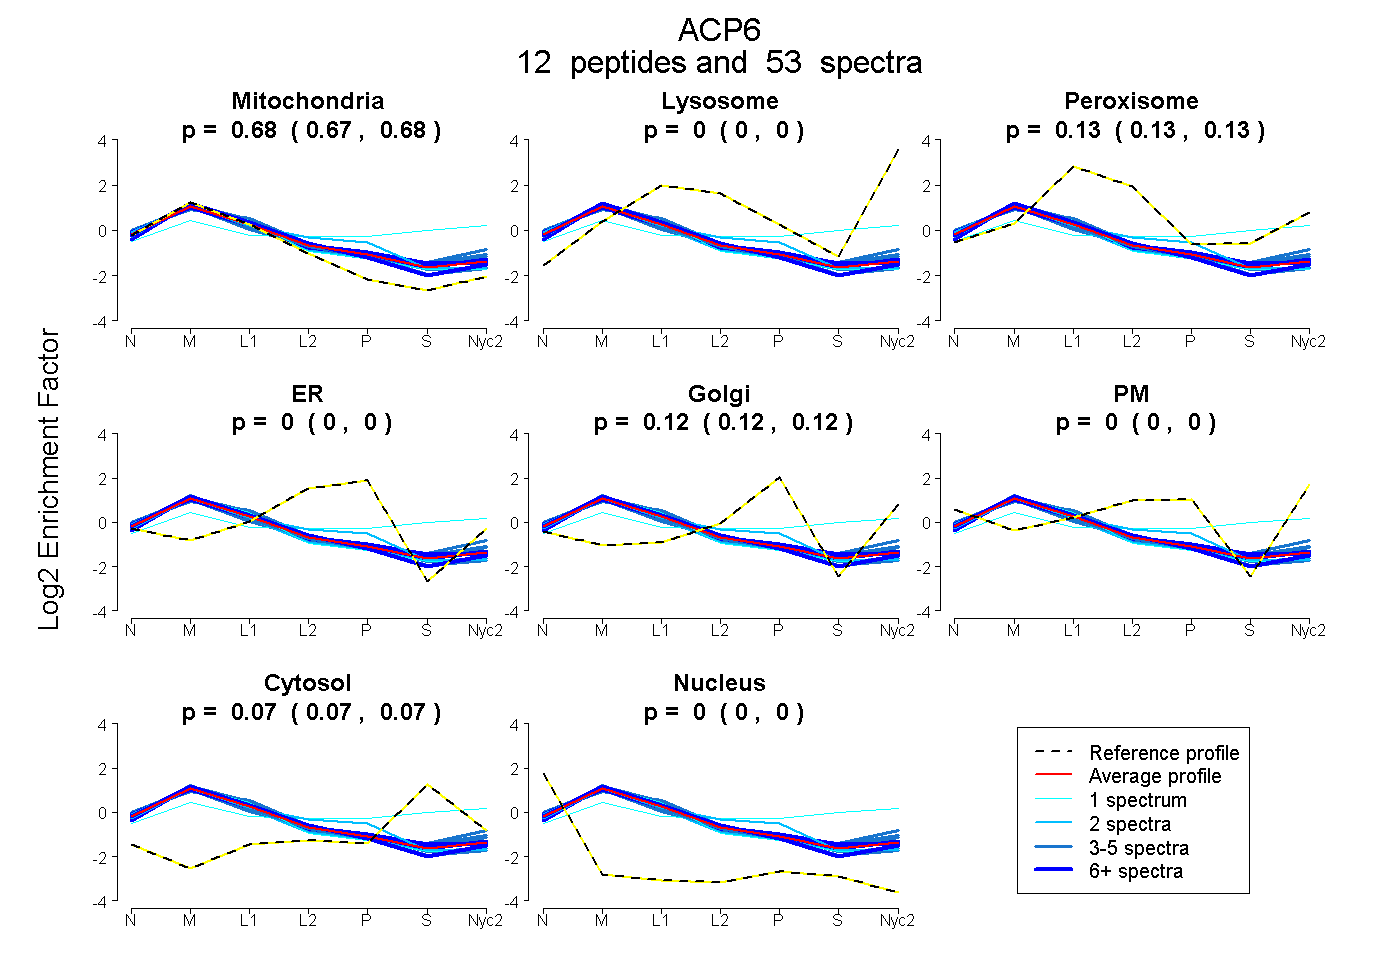
| Expt A |
12 peptides |
53 spectra |
|
0.678 0.674 | 0.681 |
0.000 0.000 | 0.000 |
0.132 0.129 | 0.135 |
0.000 0.000 | 0.000 |
0.120 0.116 | 0.123 |
0.000 0.000 | 0.000 |
0.071 0.067 | 0.074 |
0.000 0.000 | 0.000 |
| 3 spectra, GGMFAGQLTK | 0.589 | 0.009 | 0.171 | 0.000 | 0.000 | 0.127 | 0.104 | 0.000 | ||
| 3 spectra, AVDMALYMLQQEDR | 0.679 | 0.032 | 0.153 | 0.000 | 0.072 | 0.000 | 0.063 | 0.000 | ||
| 4 spectra, AAISQPGILEDLEK | 0.728 | 0.000 | 0.107 | 0.007 | 0.103 | 0.000 | 0.054 | 0.000 | ||
| 4 spectra, NLESTR | 0.771 | 0.000 | 0.057 | 0.058 | 0.074 | 0.000 | 0.040 | 0.000 | ||
| 9 spectra, VGMQQMFALGER | 0.746 | 0.000 | 0.118 | 0.007 | 0.115 | 0.000 | 0.013 | 0.000 | ||
| 4 spectra, FAQLIEQR | 0.646 | 0.032 | 0.070 | 0.000 | 0.052 | 0.081 | 0.120 | 0.000 | ||
| 11 spectra, LLEIPPQTR | 0.657 | 0.000 | 0.133 | 0.000 | 0.116 | 0.000 | 0.094 | 0.000 | ||
| 2 spectra, STNMFR | 0.632 | 0.000 | 0.069 | 0.241 | 0.000 | 0.000 | 0.058 | 0.000 | ||
| 1 spectrum, FLNTMSAYSVSPEK | 0.237 | 0.204 | 0.076 | 0.000 | 0.067 | 0.076 | 0.340 | 0.000 | ||
| 2 spectra, LSYNGQEQVPR | 0.755 | 0.000 | 0.073 | 0.000 | 0.098 | 0.000 | 0.075 | 0.000 | ||
| 9 spectra, MVQVVFR | 0.683 | 0.010 | 0.120 | 0.000 | 0.121 | 0.000 | 0.066 | 0.000 | ||
| 1 spectrum, SPLKPLPLEDQVEWNPK | 0.773 | 0.000 | 0.104 | 0.000 | 0.061 | 0.000 | 0.062 | 0.000 |
| Plot | Mito | Lyso or Perox | ER | Golgi | PM | Cytosol | Nucleus | ||||||
| Expt B |
5 peptides |
17 spectra |
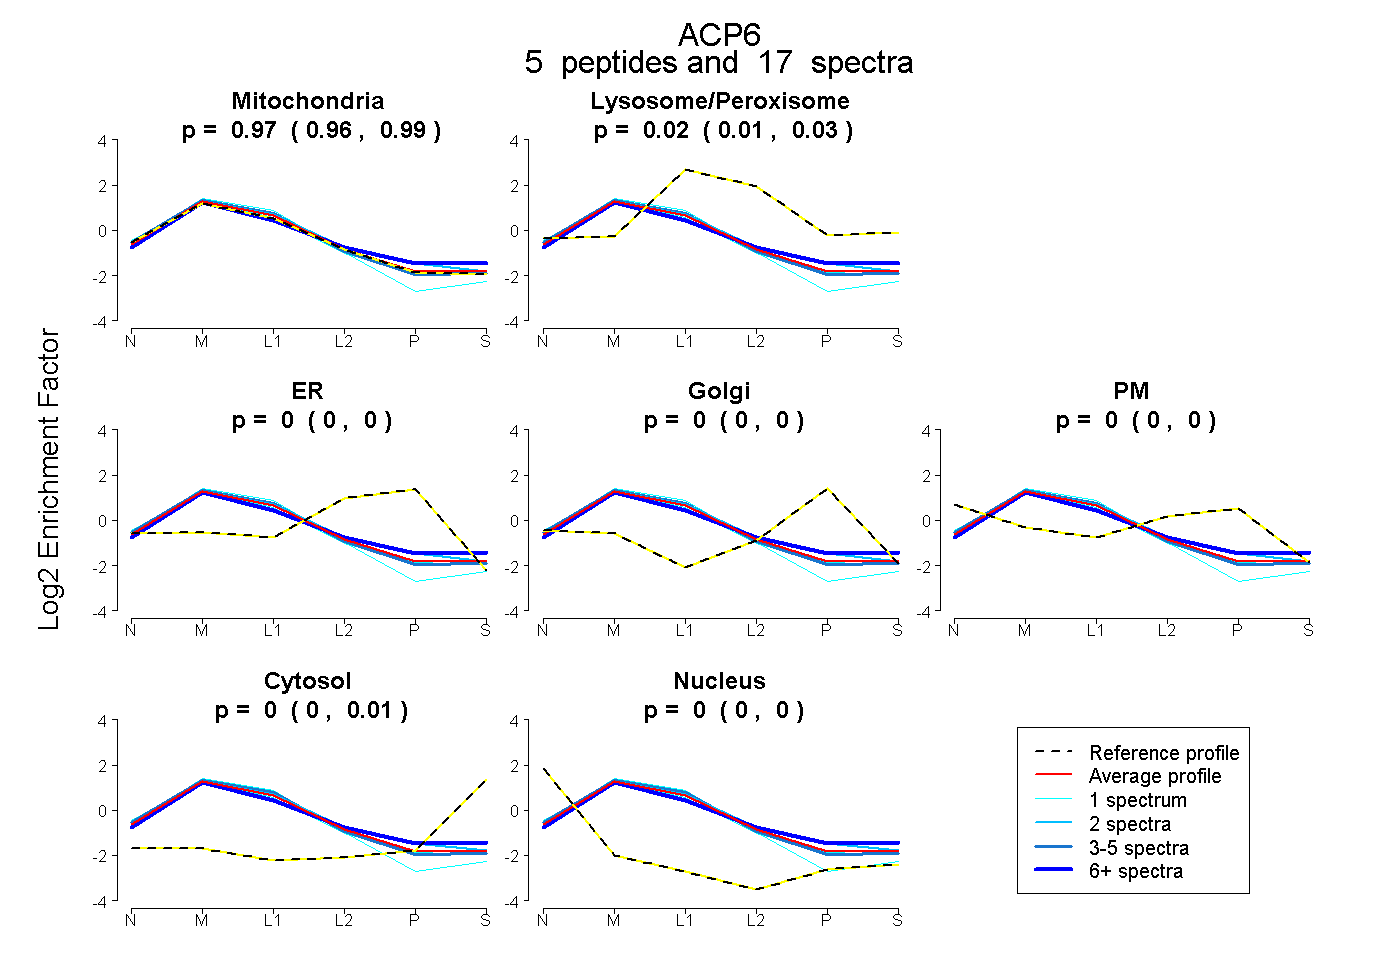 |
0.974 0.959 | 0.985 |
0.022 0.012 | 0.031 |
0.000 0.000 | 0.000 |
0.000 0.000 | 0.000 |
0.000 0.000 | 0.000 |
0.003 0.000 | 0.011 |
0.000 0.000 | 0.000 |
|||
| Plot | Lyso | Other | |||||||||||
| Expt C |
17 peptides |
154 spectra |
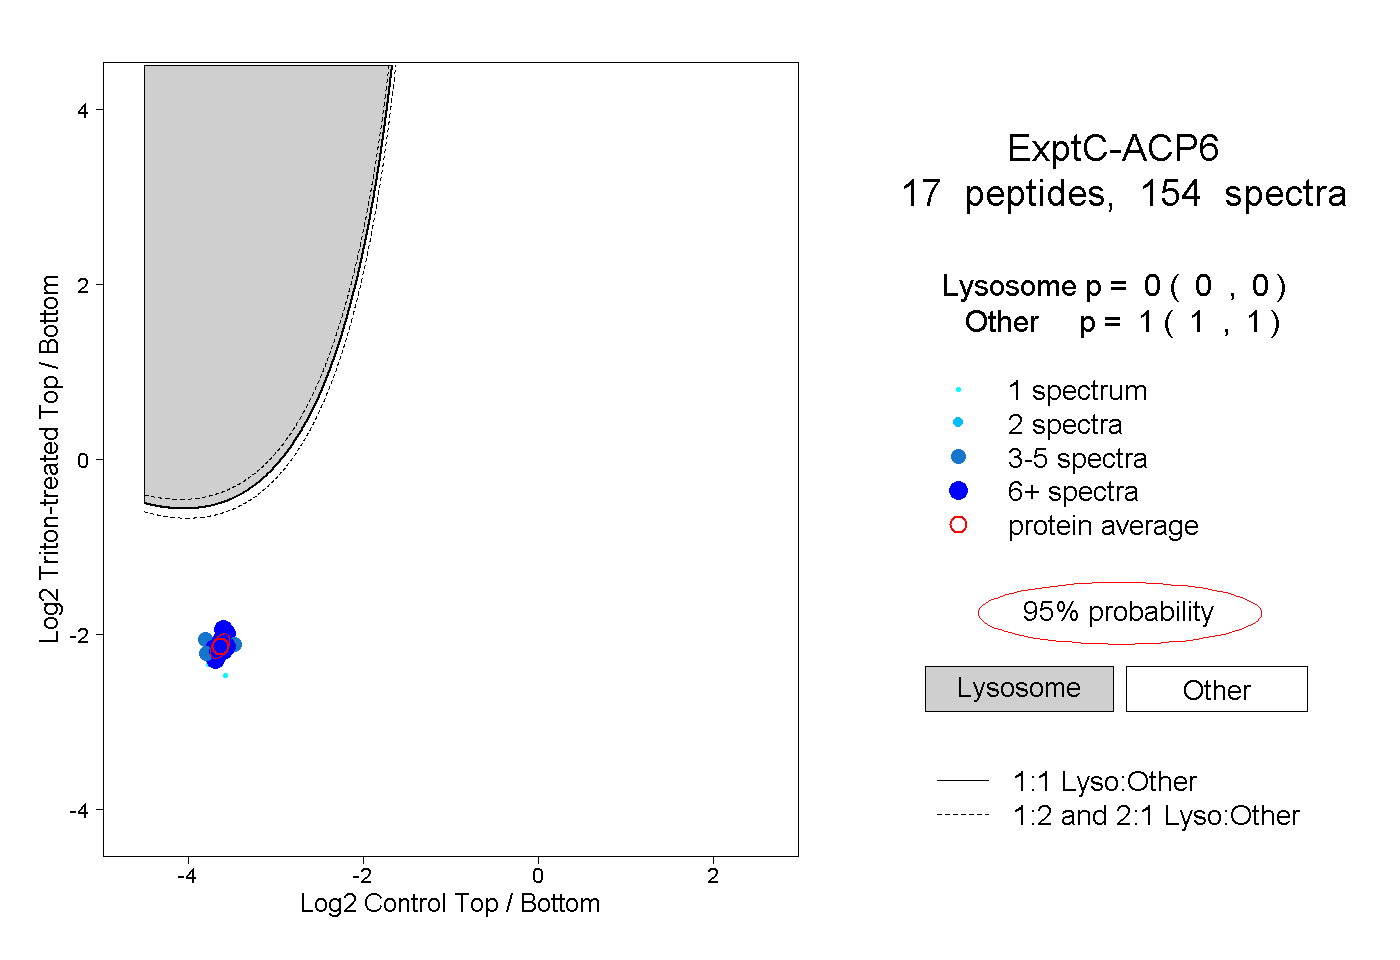 |
0.000 0.000 | 0.000 |
1.000 1.000 | 1.000 |
||||||||
| Plot | Lyso | Other | |||||||||||
| Expt D |
7 peptides |
13 spectra |
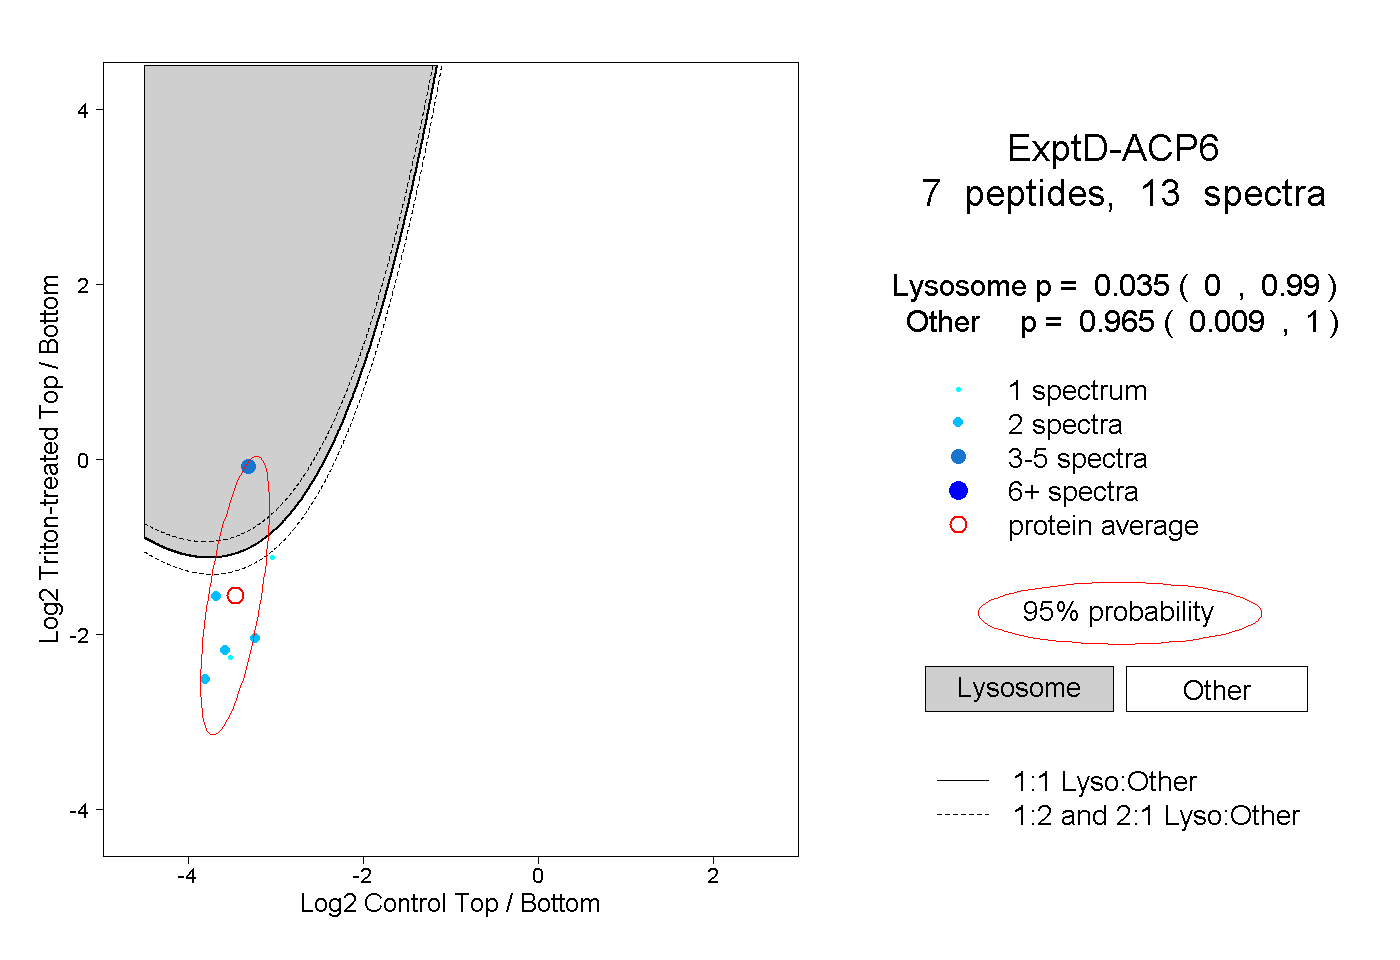 |
0.035 0.000 | 0.990 |
0.965 0.009 | 1.000 |