 22
22peptides
spectra

0.042 | 0.050
0.000 | 0.000
0.000 | 0.000
0.000 | 0.000
0.000 | 0.000
0.732 | 0.738
0.000 | 0.000
0.216 | 0.220
10peptides
spectra
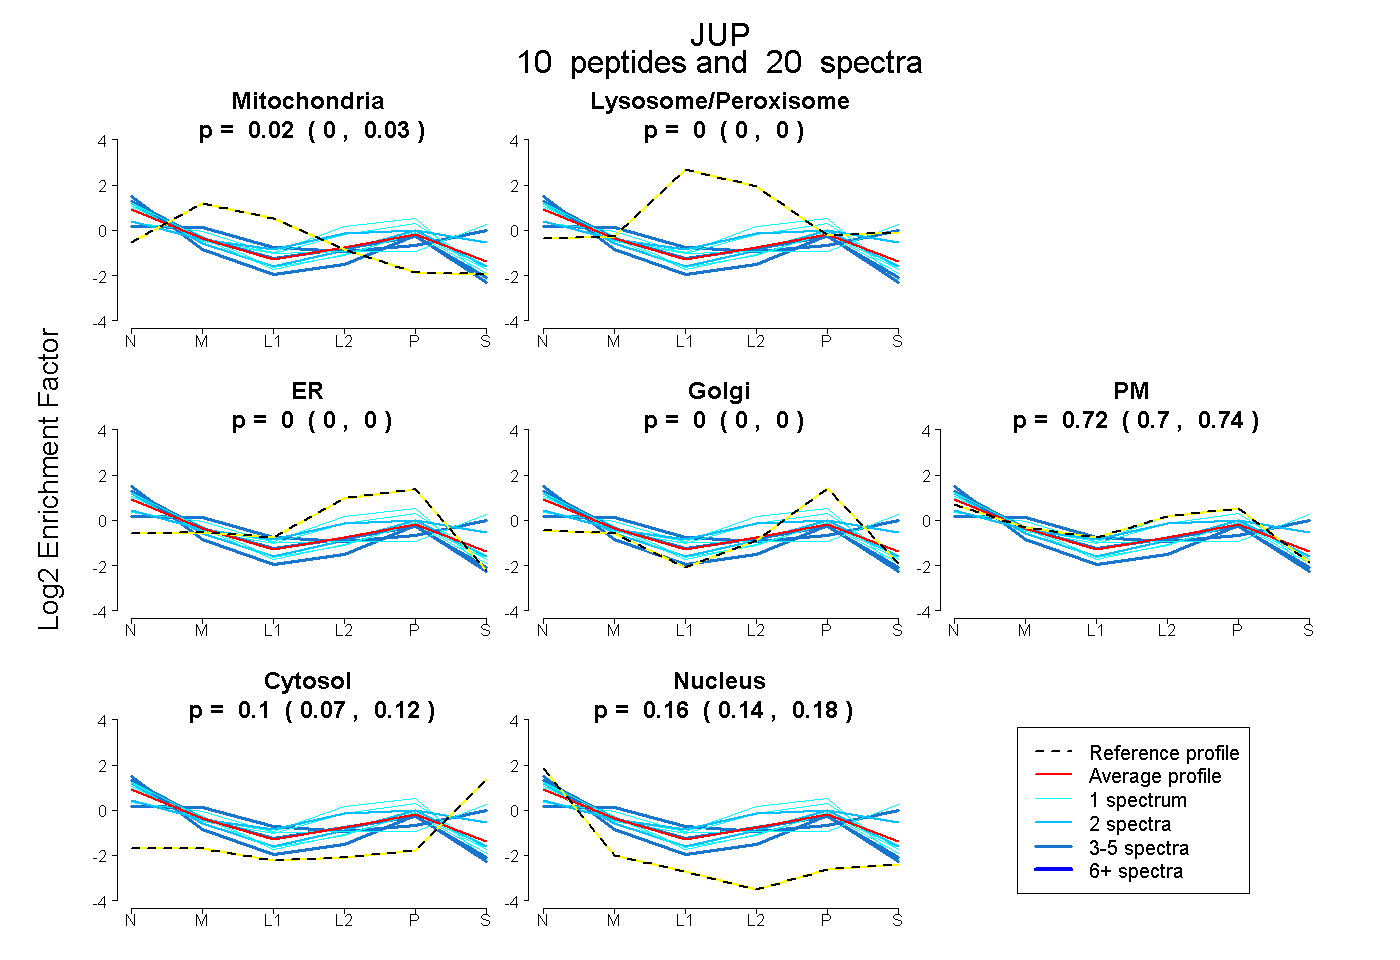
0.000 | 0.034
0.000 | 0.000
0.000 | 0.000
0.000 | 0.000
0.705 | 0.738
0.071 | 0.117
0.145 | 0.178
26peptides
spectra
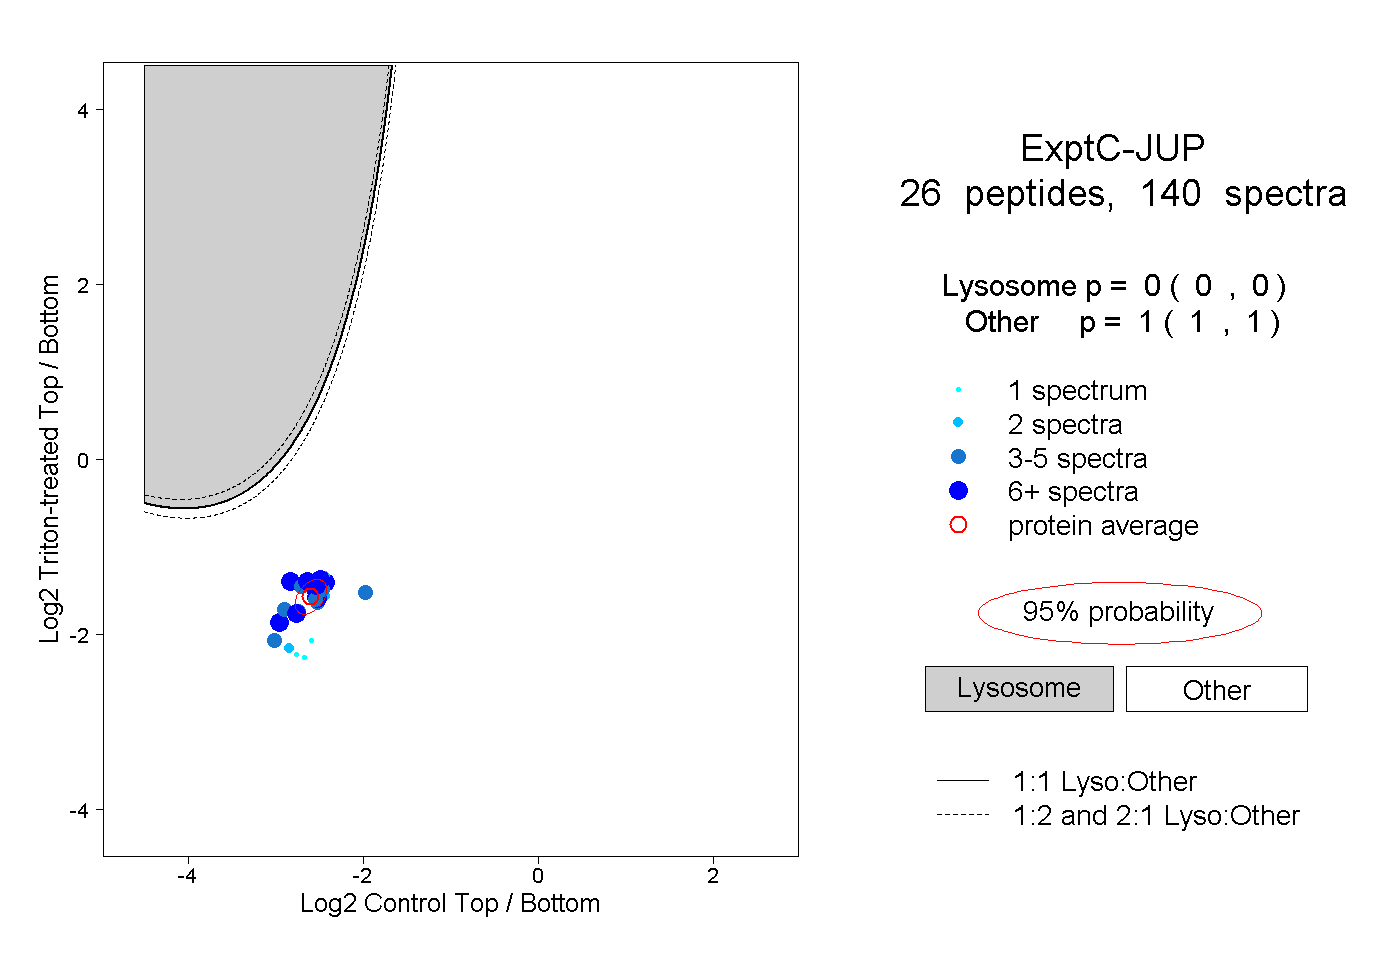
0.000 | 0.000
1.000 | 1.000
7peptides
spectra
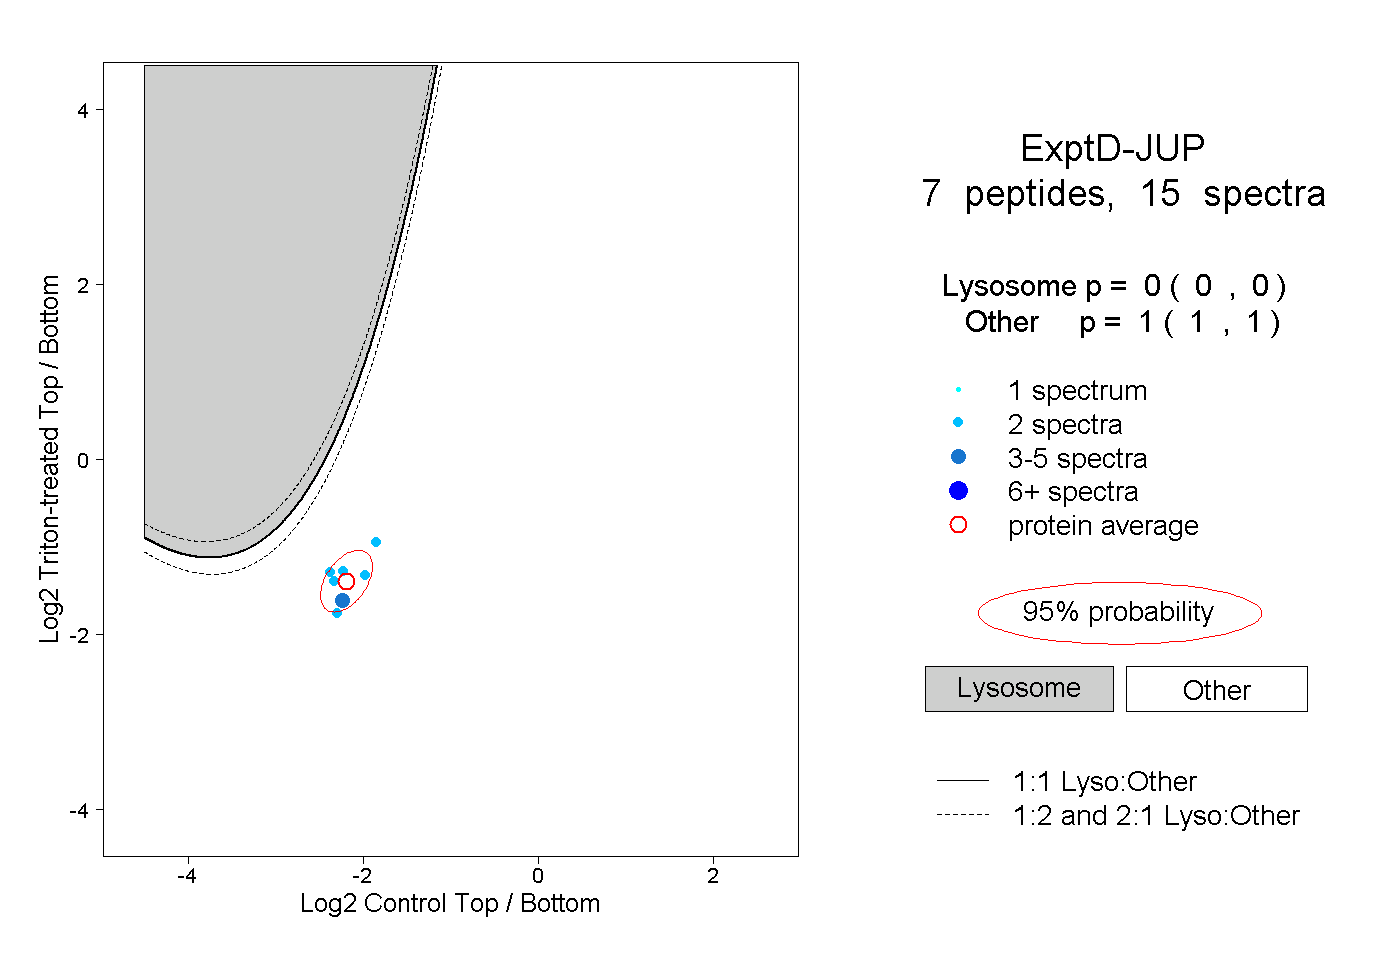
0.000 | 0.000
1.000 | 1.000