 17
17peptides
spectra

0.129 | 0.140
0.000 | 0.000
0.065 | 0.079
0.448 | 0.484
0.152 | 0.187
0.000 | 0.000
0.147 | 0.159
0.000 | 0.000
4peptides
spectra
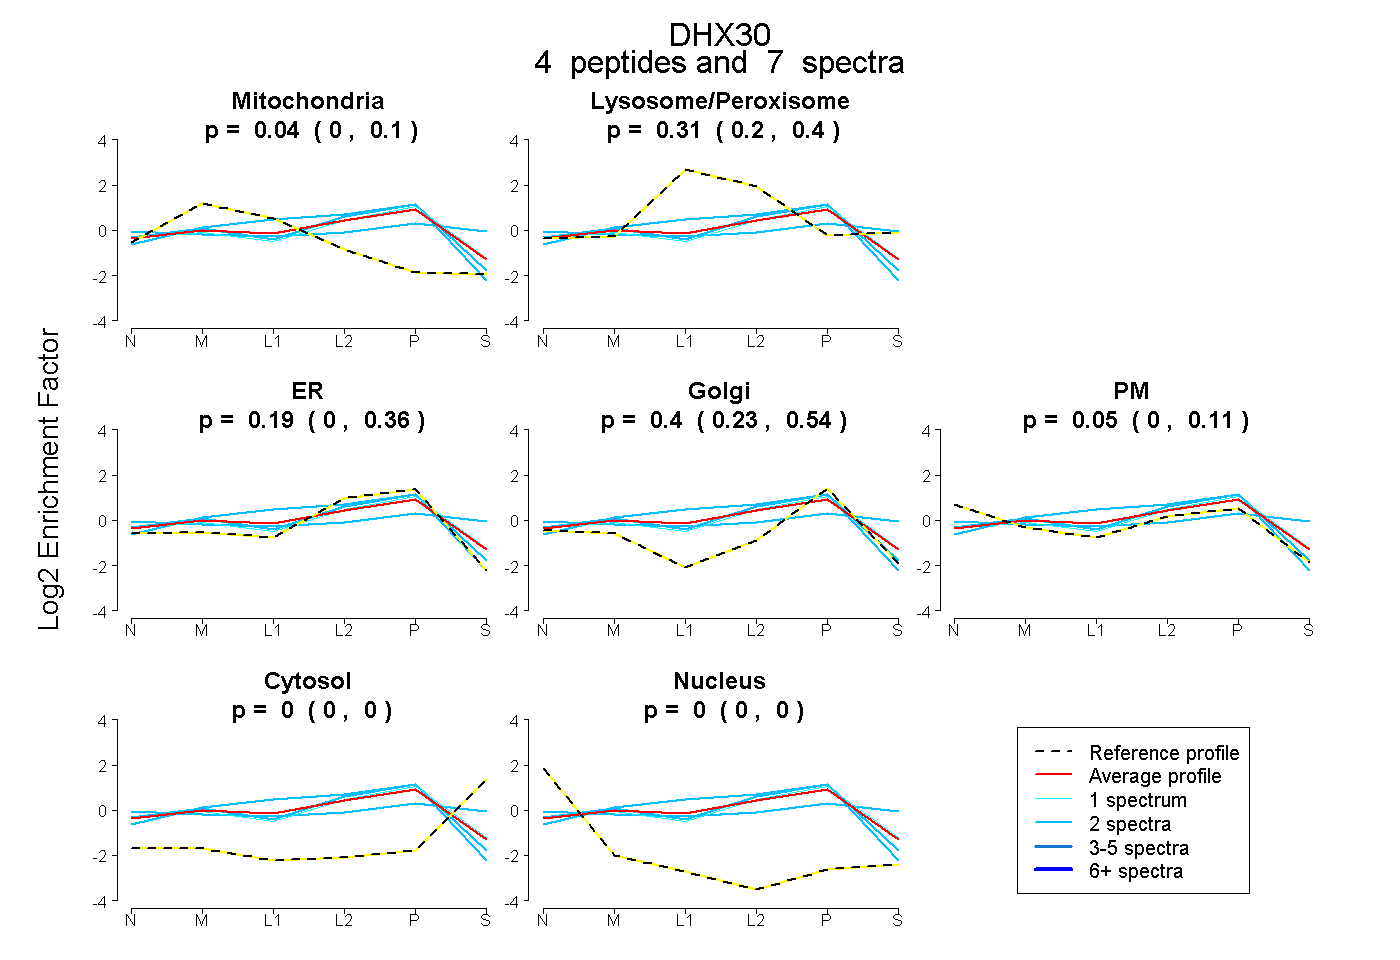
0.000 | 0.099
0.199 | 0.402
0.002 | 0.365
0.228 | 0.537
0.000 | 0.112
0.000 | 0.000
0.000 | 0.000
29peptides
spectra
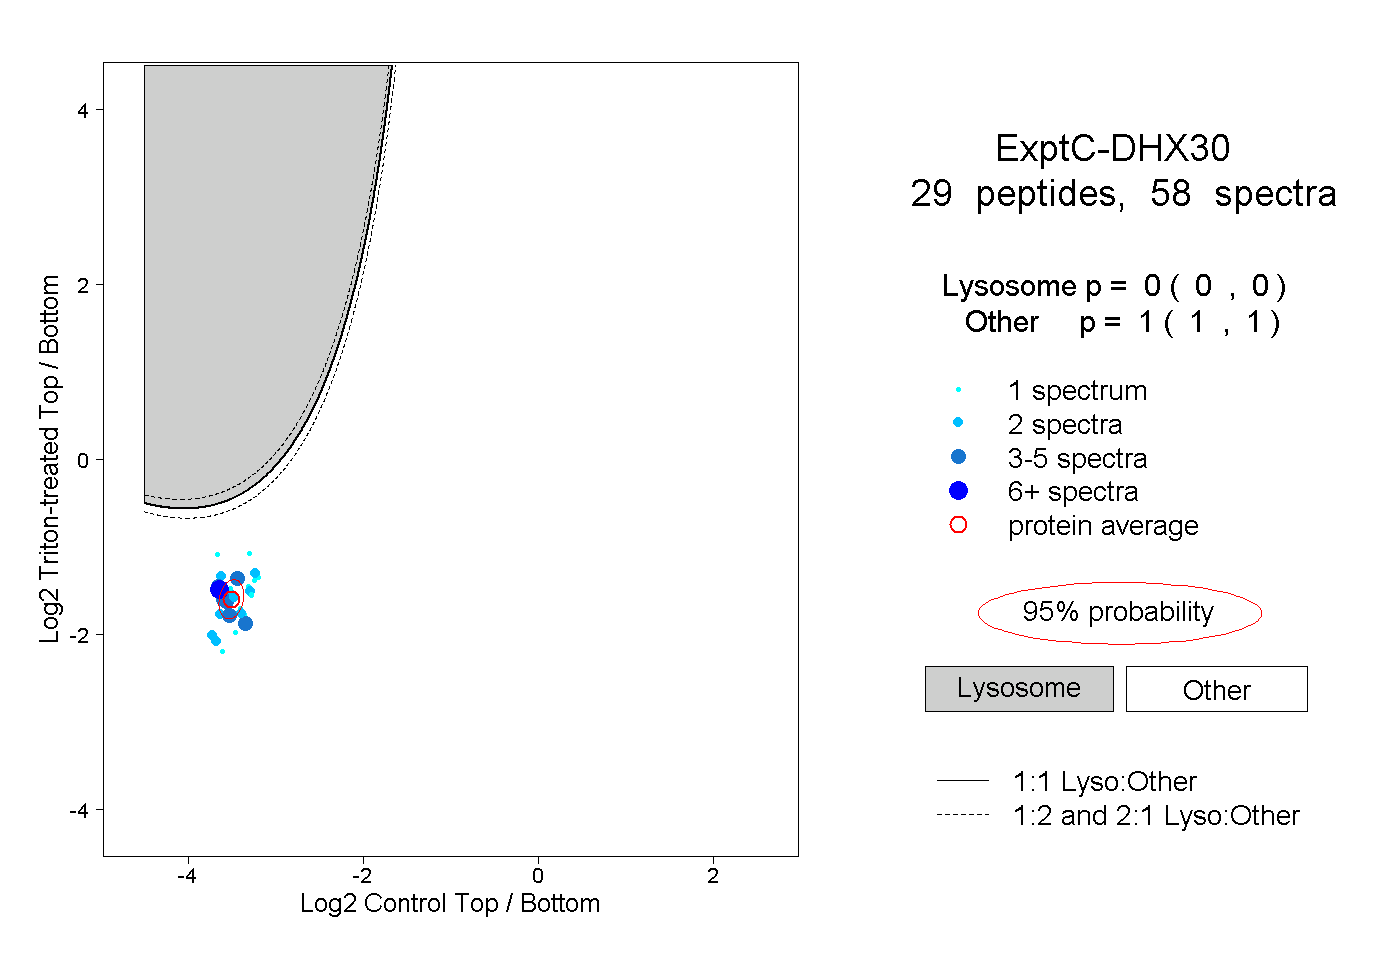
0.000 | 0.000
1.000 | 1.000