DHX30
[ENSRNOP00000043896]
Main page
| | | Plot |
Mito |
Lyso |
|
Perox |
ER |
Golgi |
PM |
Cytosol |
Nucleus |
|
| Expt A |
 17
17
peptides |
36
spectra |
 |
0.135
0.129 | 0.140 |
0.000
0.000 | 0.000 |
|
0.073
0.065 | 0.079 |
0.468
0.448 | 0.484 |
0.171
0.152 | 0.187 |
0.000
0.000 | 0.000 |
0.153
0.147 | 0.159 |
0.000
0.000 | 0.000 |
|
| | | Plot |
Mito |
|
Lyso or Perox |
|
ER |
Golgi |
PM |
Cytosol |
Nucleus |
|
| Expt B |
4
peptides |
7
spectra |
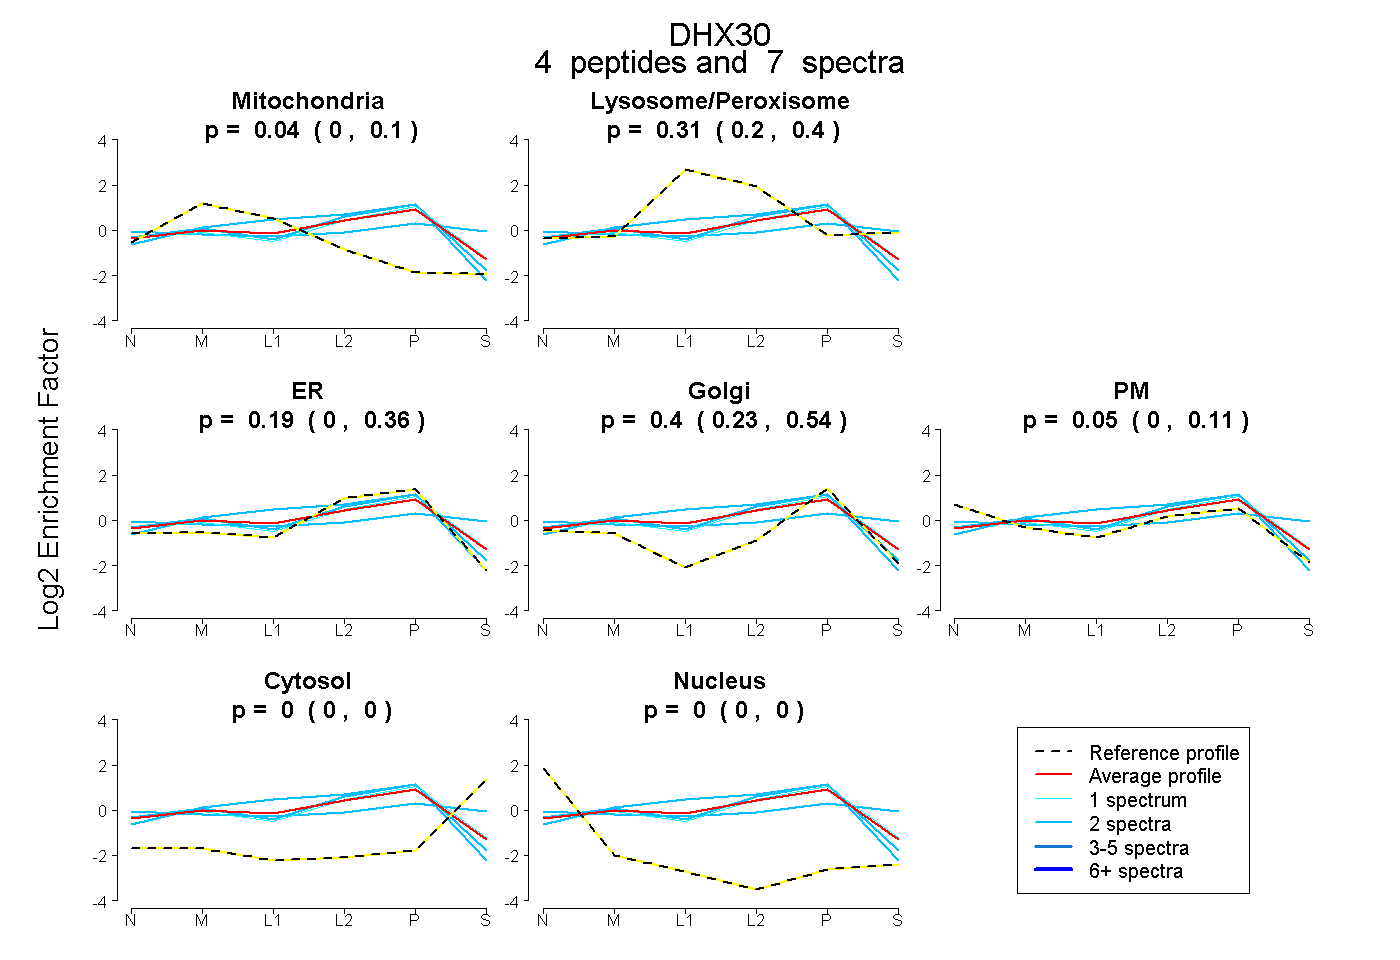 |
0.044
0.000 | 0.099 |
|
0.313
0.199 | 0.402 |
|
0.193
0.002 | 0.365 |
0.403
0.228 | 0.537 |
0.046
0.000 | 0.112 |
0.000
0.000 | 0.000 |
0.000
0.000 | 0.000 |
|
| 2 spectra, RPCTIQVPEPILR |
0.000 |
|
0.325 |
|
0.000 |
0.191 |
0.267 |
0.217 |
0.000 |
|
| 2 spectra, FIHGLIK |
0.108 |
|
0.236 |
|
0.631 |
0.025 |
0.000 |
0.000 |
0.000 |
|
| 2 spectra, NLLNSVIGR |
0.127 |
|
0.012 |
|
0.754 |
0.000 |
0.107 |
0.000 |
0.000 |
|
| 1 spectrum, TPLENLVLQAK |
0.000 |
|
0.296 |
|
0.198 |
0.484 |
0.022 |
0.000 |
0.000 |
|
| | | Plot |
|
Lyso |
|
|
|
|
|
|
|
Other |
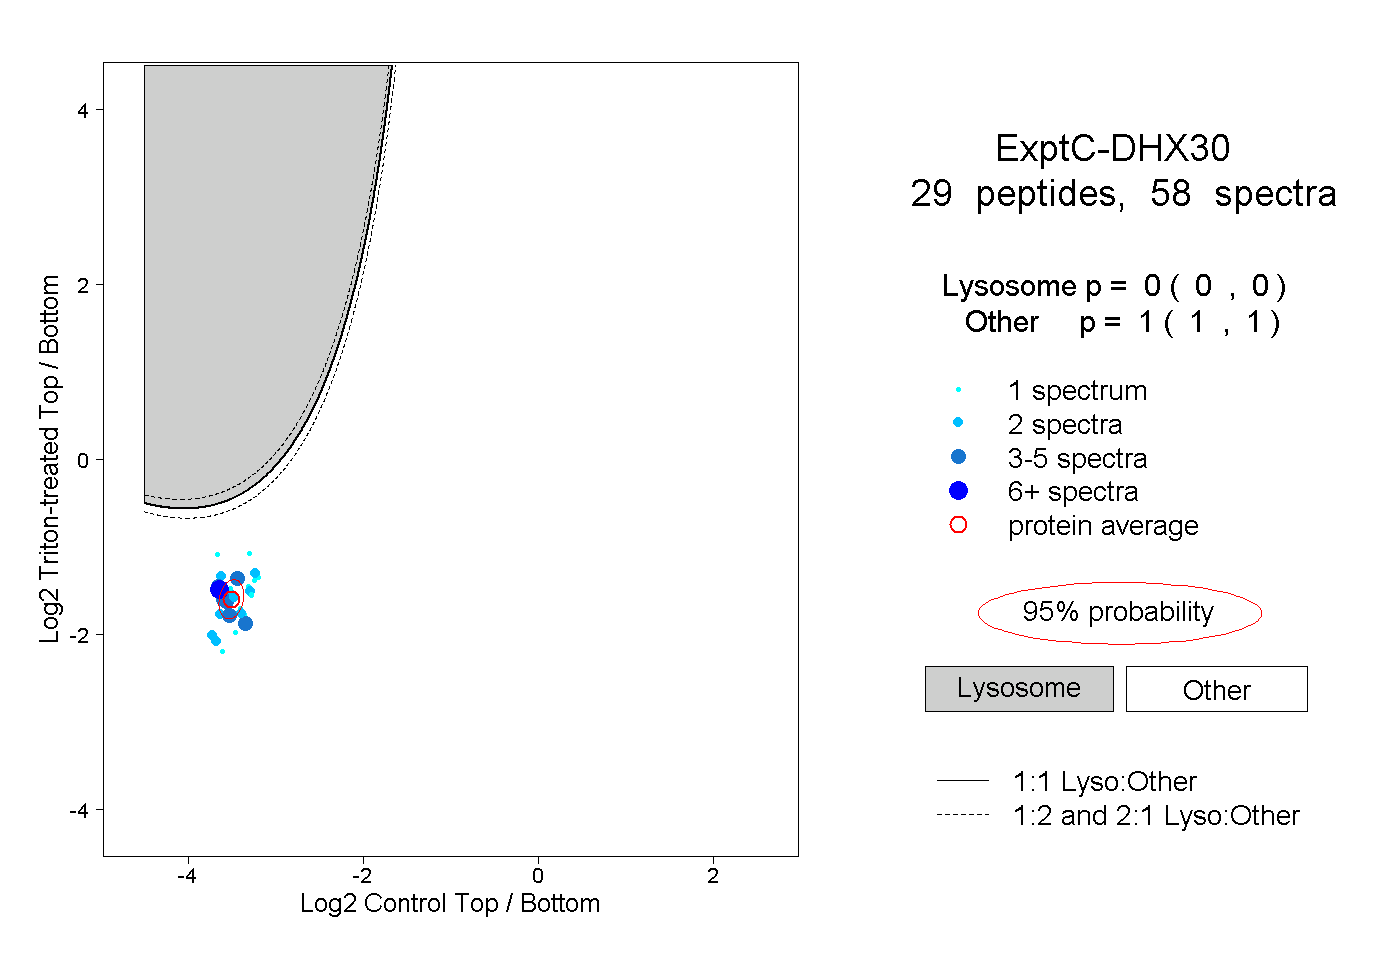
| Expt C |
29
peptides |
58
spectra |
 |
|
0.000
0.000 | 0.000 |
|
|
|
|
|
|
|
1.000
1.000 | 1.000 |