 8
8peptides
spectra
0.000 | 0.000
0.000 | 0.000
0.098 | 0.138
0.075 | 0.149
0.189 | 0.280
0.141 | 0.213
0.332 | 0.355
0.000 | 0.000
3peptides
spectra
0.000 | 0.000
1.000 | 1.000
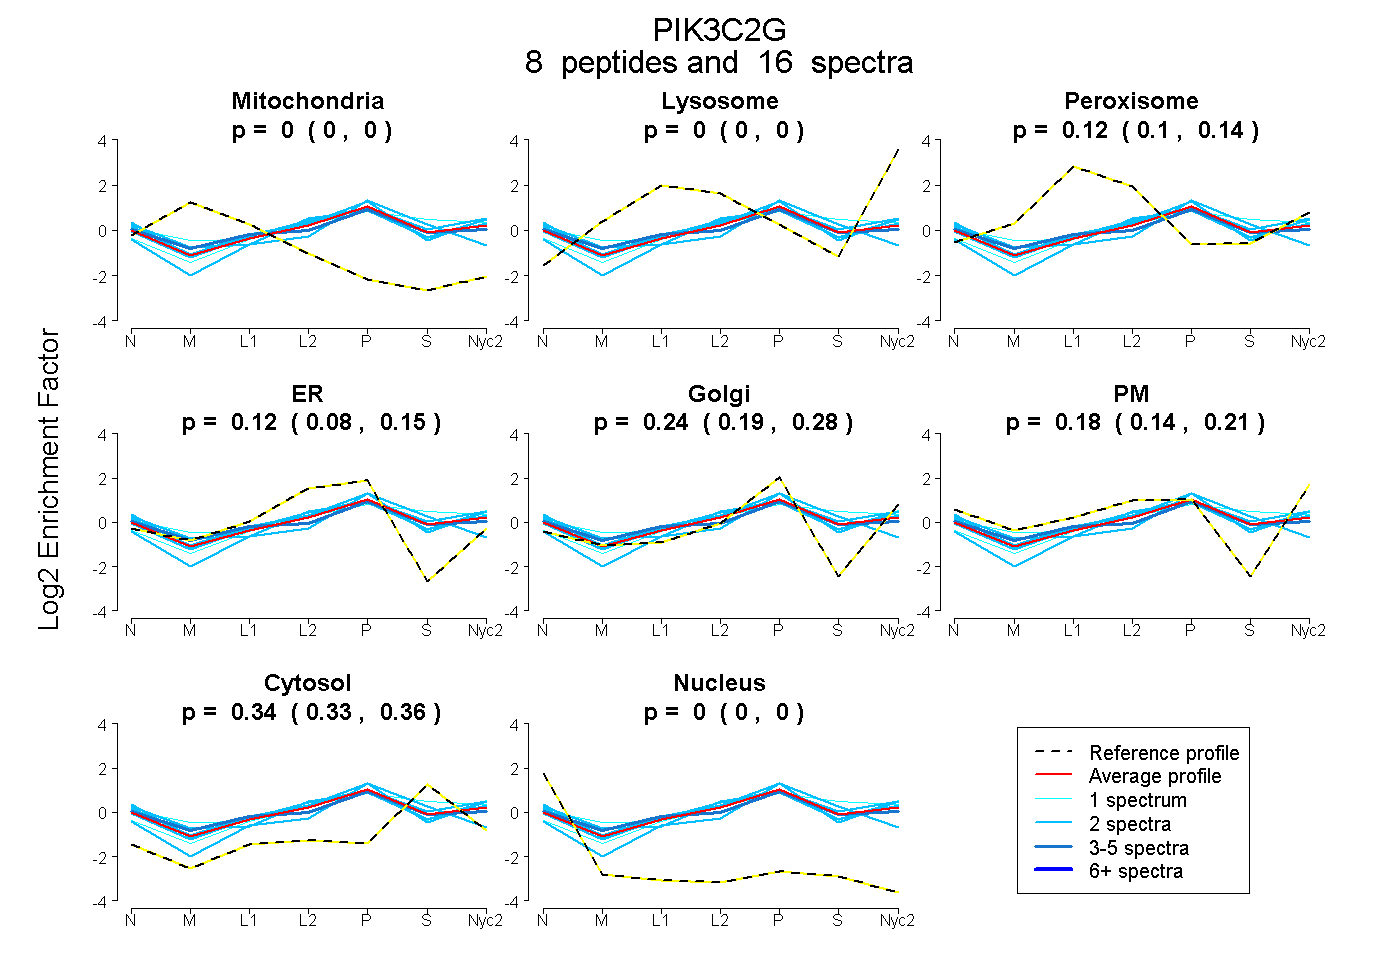
| Plot | Mito | Lyso | Perox | ER | Golgi | PM | Cytosol | Nucleus | |||||
| Expt A |
8 peptides |
16 spectra |
|
0.000 0.000 | 0.000 |
0.000 0.000 | 0.000 |
0.120 0.098 | 0.138 |
0.117 0.075 | 0.149 |
0.238 0.189 | 0.280 |
0.180 0.141 | 0.213 |
0.345 0.332 | 0.355 |
0.000 0.000 | 0.000 |
||
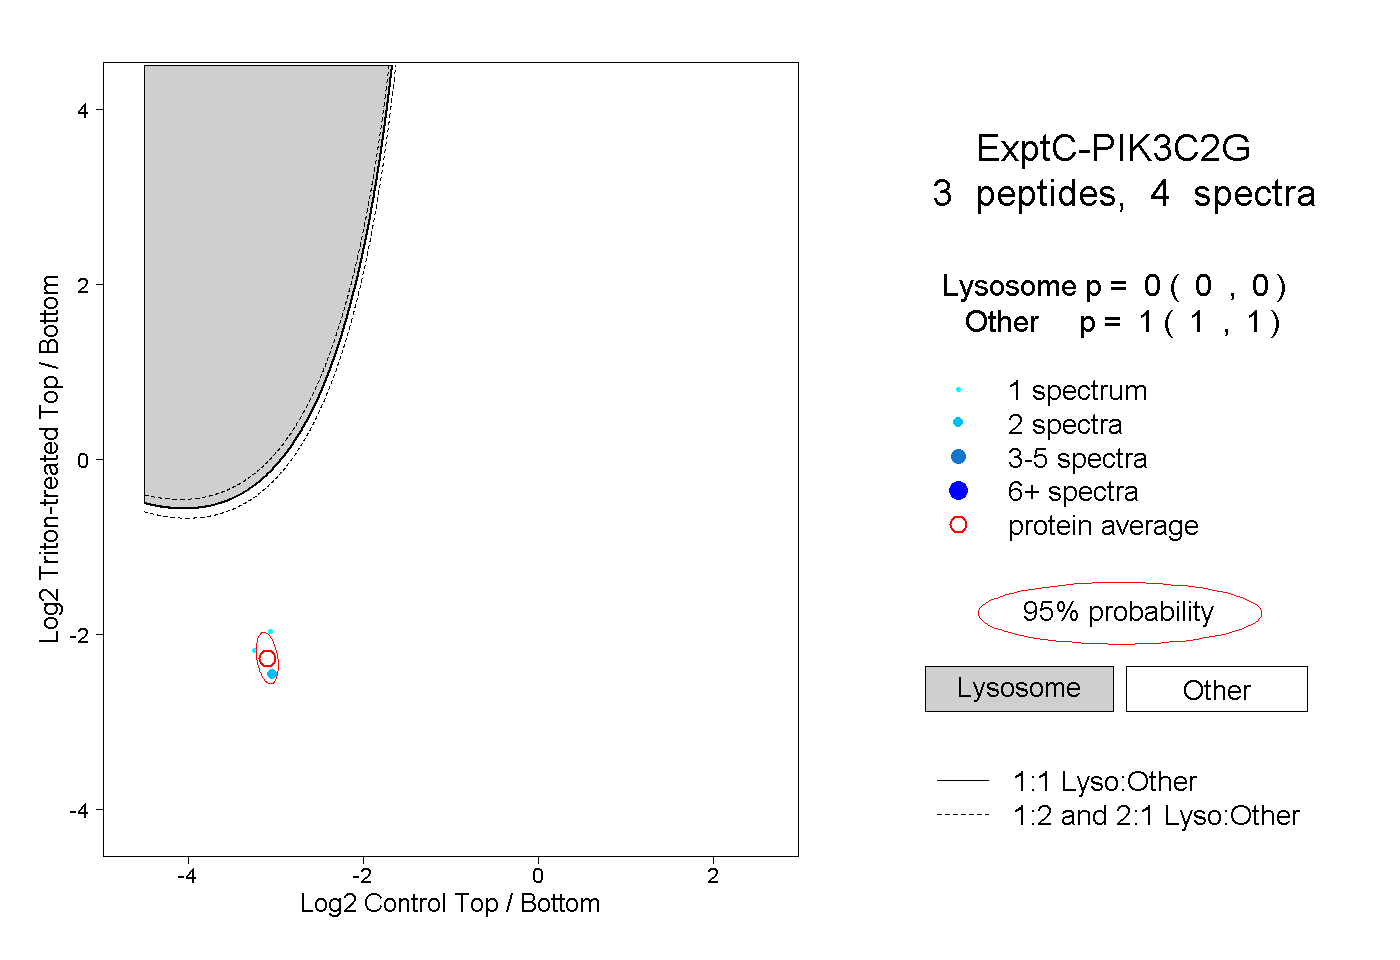
| Plot | Lyso | Other | |||||||||||
| Expt C |
3 peptides |
4 spectra |
|
0.000 0.000 | 0.000 |
1.000 1.000 | 1.000 |