 8
8peptides
spectra
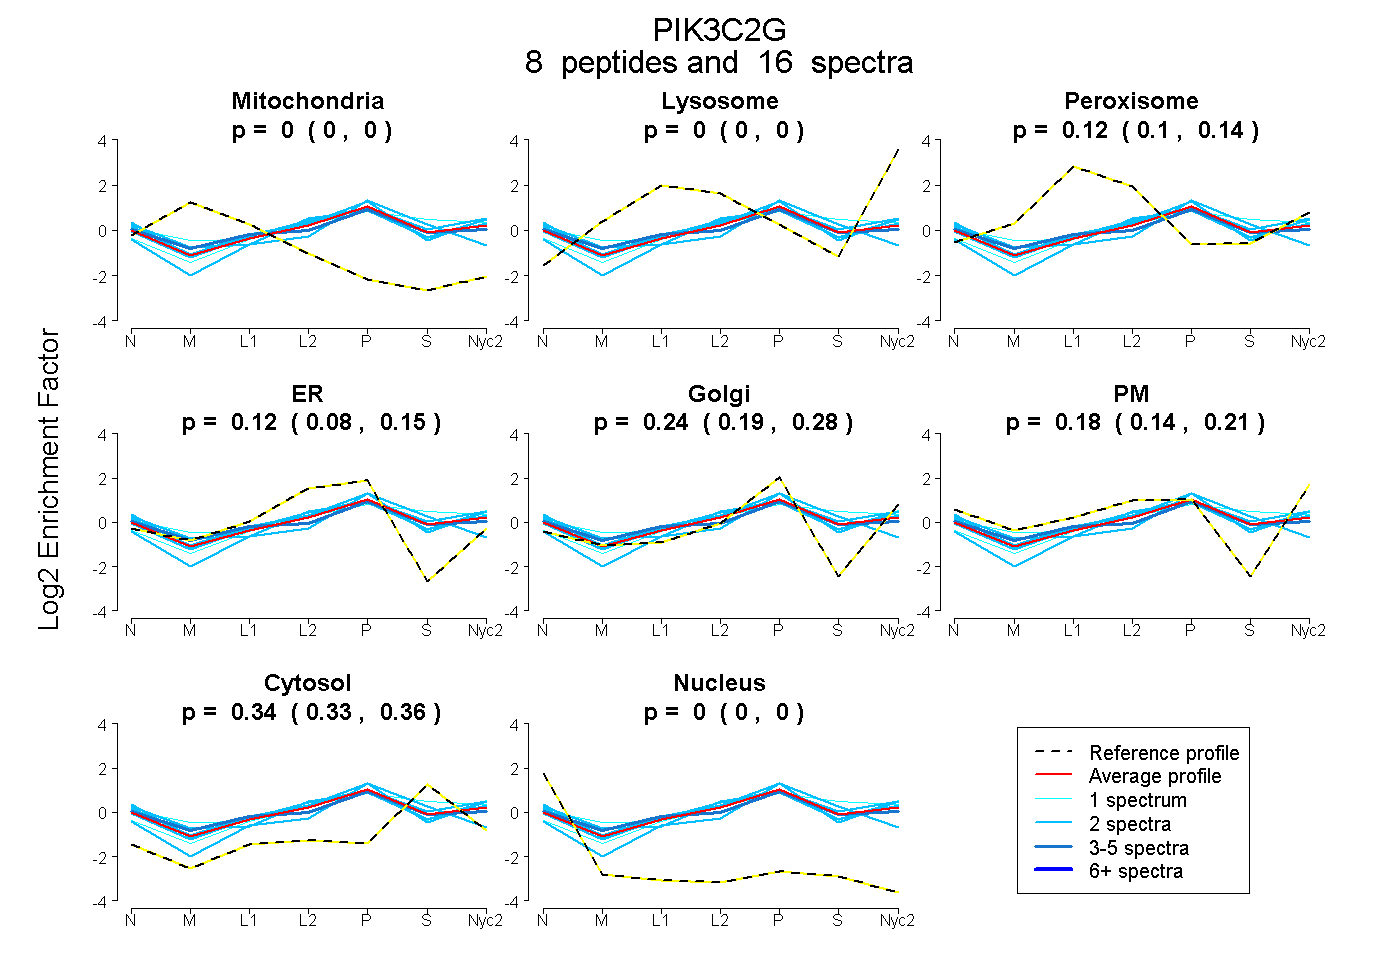
0.000 | 0.000
0.000 | 0.000
0.098 | 0.138
0.075 | 0.149
0.189 | 0.280
0.141 | 0.213
0.332 | 0.355
0.000 | 0.000
| Plot | Mito | Lyso | Perox | ER | Golgi | PM | Cytosol | Nucleus | |||||
| Expt A |
8 peptides |
16 spectra |
|
0.000 0.000 | 0.000 |
0.000 0.000 | 0.000 |
0.120 0.098 | 0.138 |
0.117 0.075 | 0.149 |
0.238 0.189 | 0.280 |
0.180 0.141 | 0.213 |
0.345 0.332 | 0.355 |
0.000 0.000 | 0.000 |
| 1 spectrum, DAQGEDYFK | 0.000 | 0.045 | 0.142 | 0.063 | 0.259 | 0.060 | 0.431 | 0.000 | ||
| 1 spectrum, FLGHAQTFGGIK | 0.000 | 0.000 | 0.146 | 0.000 | 0.277 | 0.311 | 0.266 | 0.000 | ||
| 2 spectra, IHLHSGLIGPLK | 0.000 | 0.000 | 0.009 | 0.185 | 0.000 | 0.457 | 0.349 | 0.000 | ||
| 2 spectra, SFEQFYR | 0.000 | 0.000 | 0.125 | 0.057 | 0.324 | 0.241 | 0.253 | 0.000 | ||
| 2 spectra, HPPQPHGNDIIEDVR | 0.000 | 0.000 | 0.034 | 0.117 | 0.017 | 0.487 | 0.344 | 0.000 | ||
| 2 spectra, EIGSLEEFFK | 0.000 | 0.000 | 0.000 | 0.328 | 0.160 | 0.000 | 0.512 | 0.000 | ||
| 2 spectra, LLGDIGEK | 0.000 | 0.000 | 0.154 | 0.058 | 0.220 | 0.229 | 0.339 | 0.000 | ||
| 4 spectra, SVIQLHLQR | 0.000 | 0.000 | 0.213 | 0.043 | 0.374 | 0.049 | 0.320 | 0.000 |
| Plot | Lyso | Other | |||||||||||
| Expt C |
3 peptides |
4 spectra |
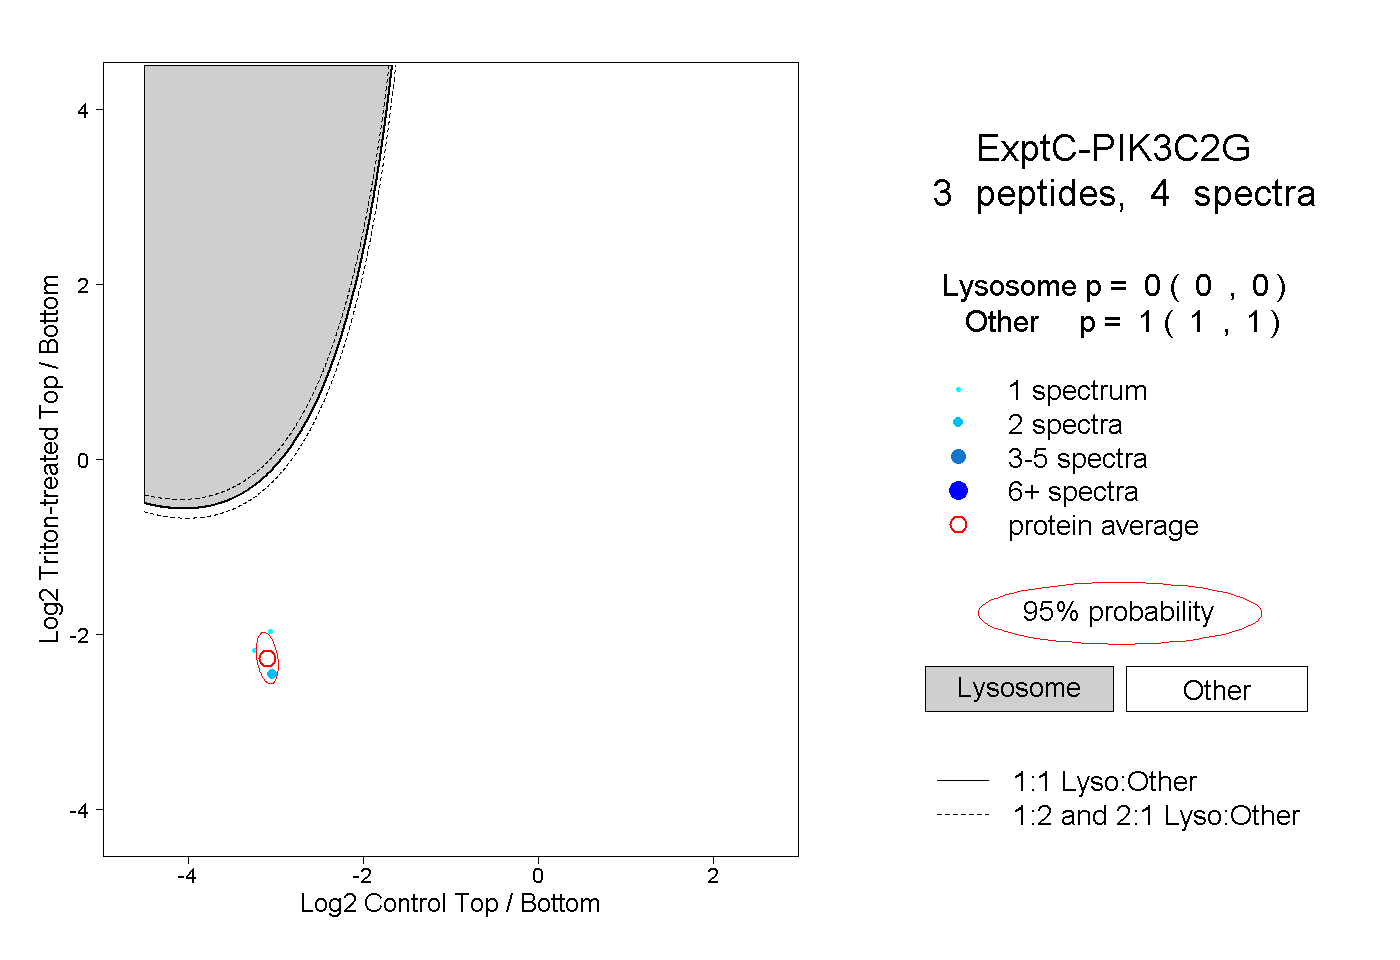 |
0.000 0.000 | 0.000 |
1.000 1.000 | 1.000 |