 34
34peptides
spectra
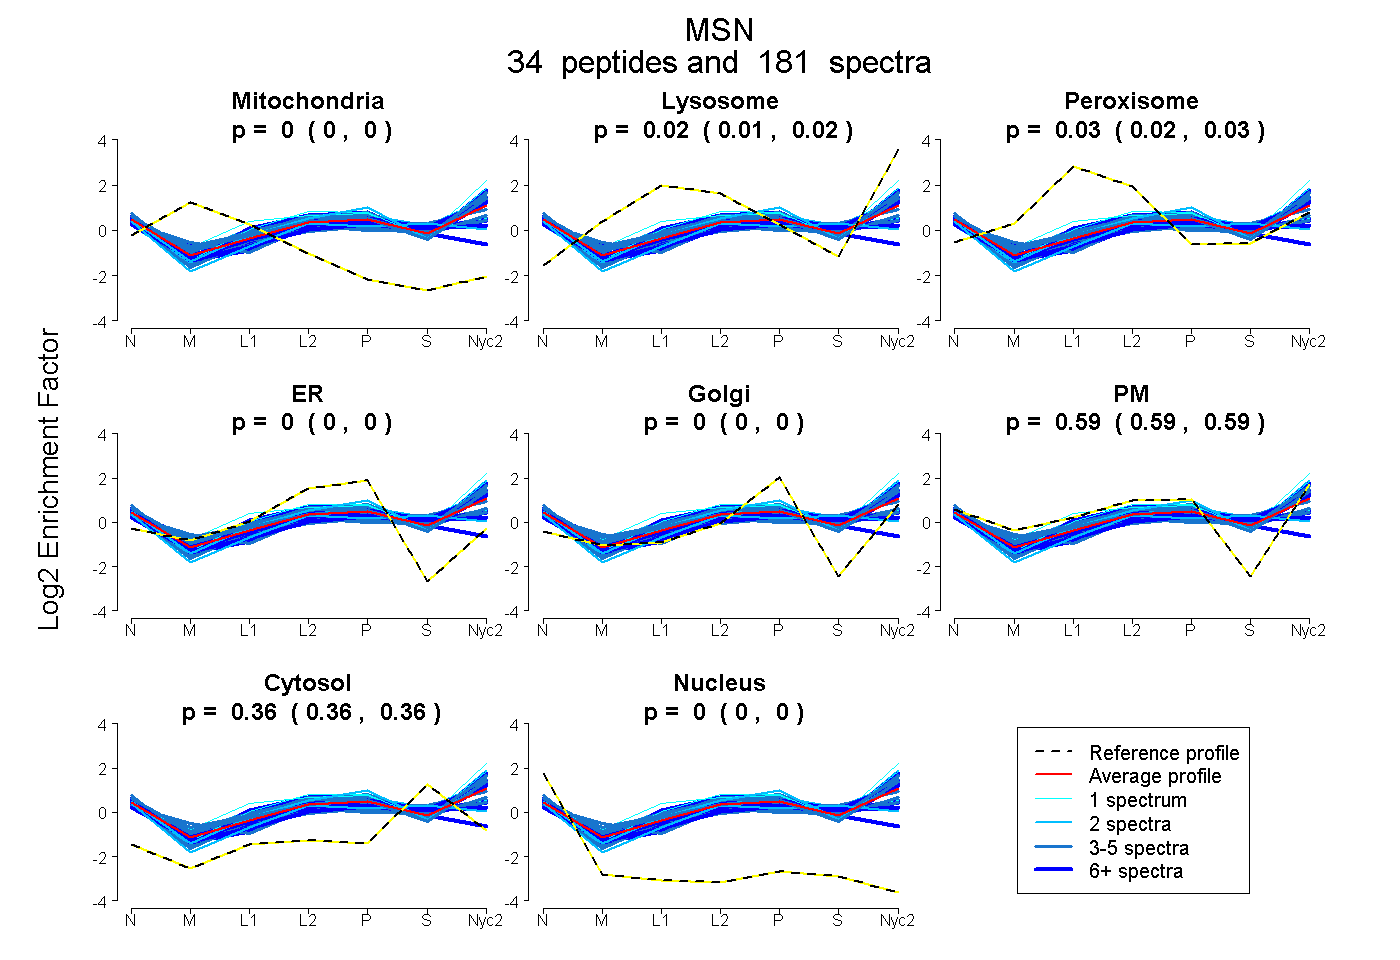
0.000 | 0.000
0.015 | 0.023
0.024 | 0.030
0.000 | 0.000
0.000 | 0.000
0.588 | 0.591
0.363 | 0.364
0.000 | 0.000
21peptides
spectra

0.000 | 0.000
0.057 | 0.066
0.000 | 0.000
0.000 | 0.000
0.642 | 0.650
0.289 | 0.294
0.000 | 0.000
34peptides
spectra
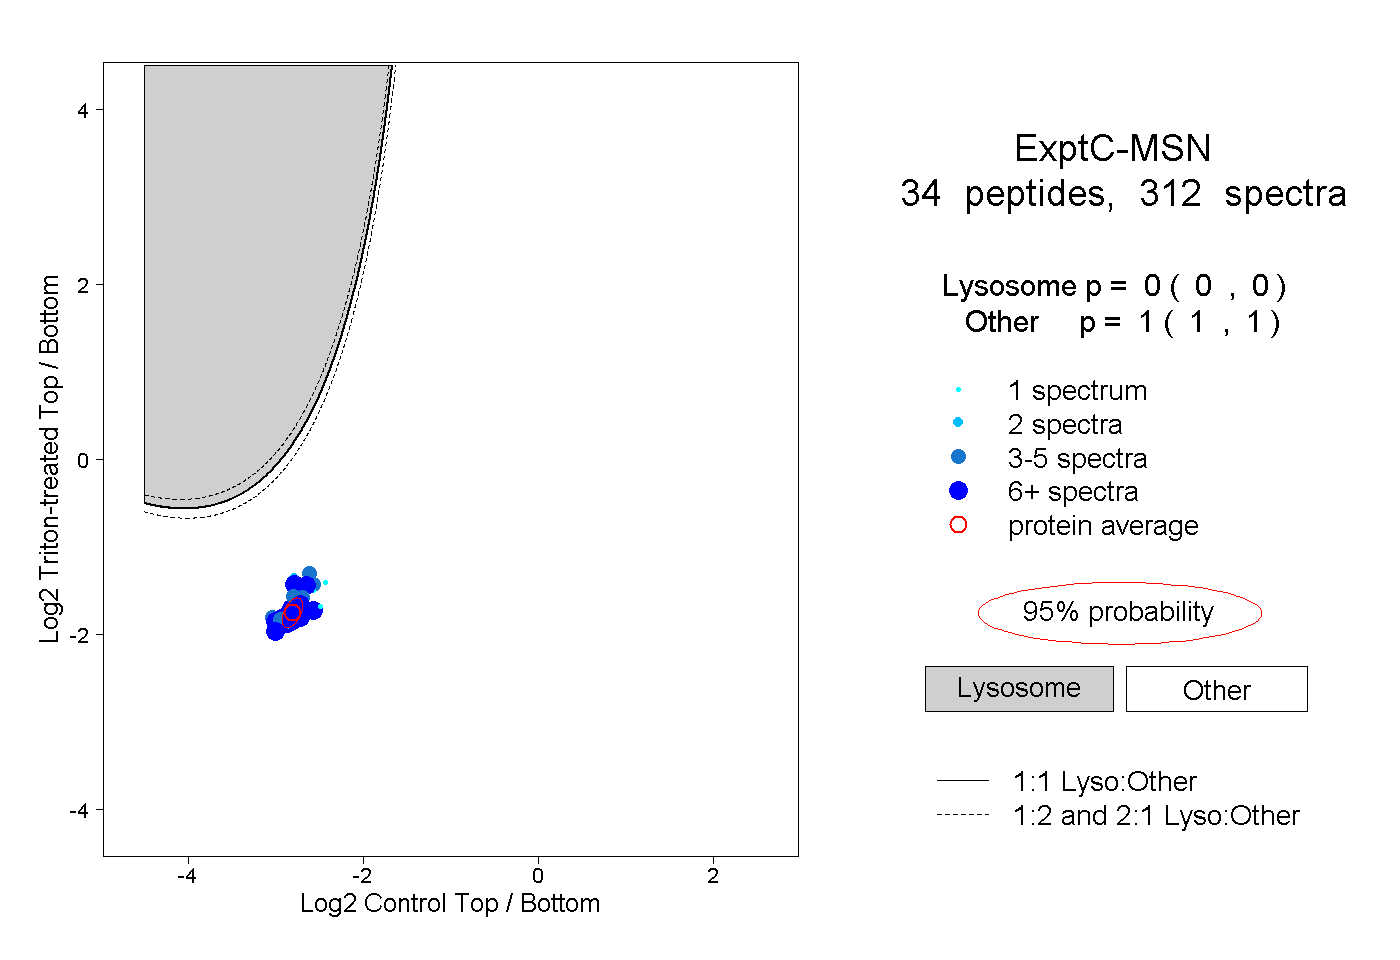
0.000 | 0.000
1.000 | 1.000
12peptides
spectra
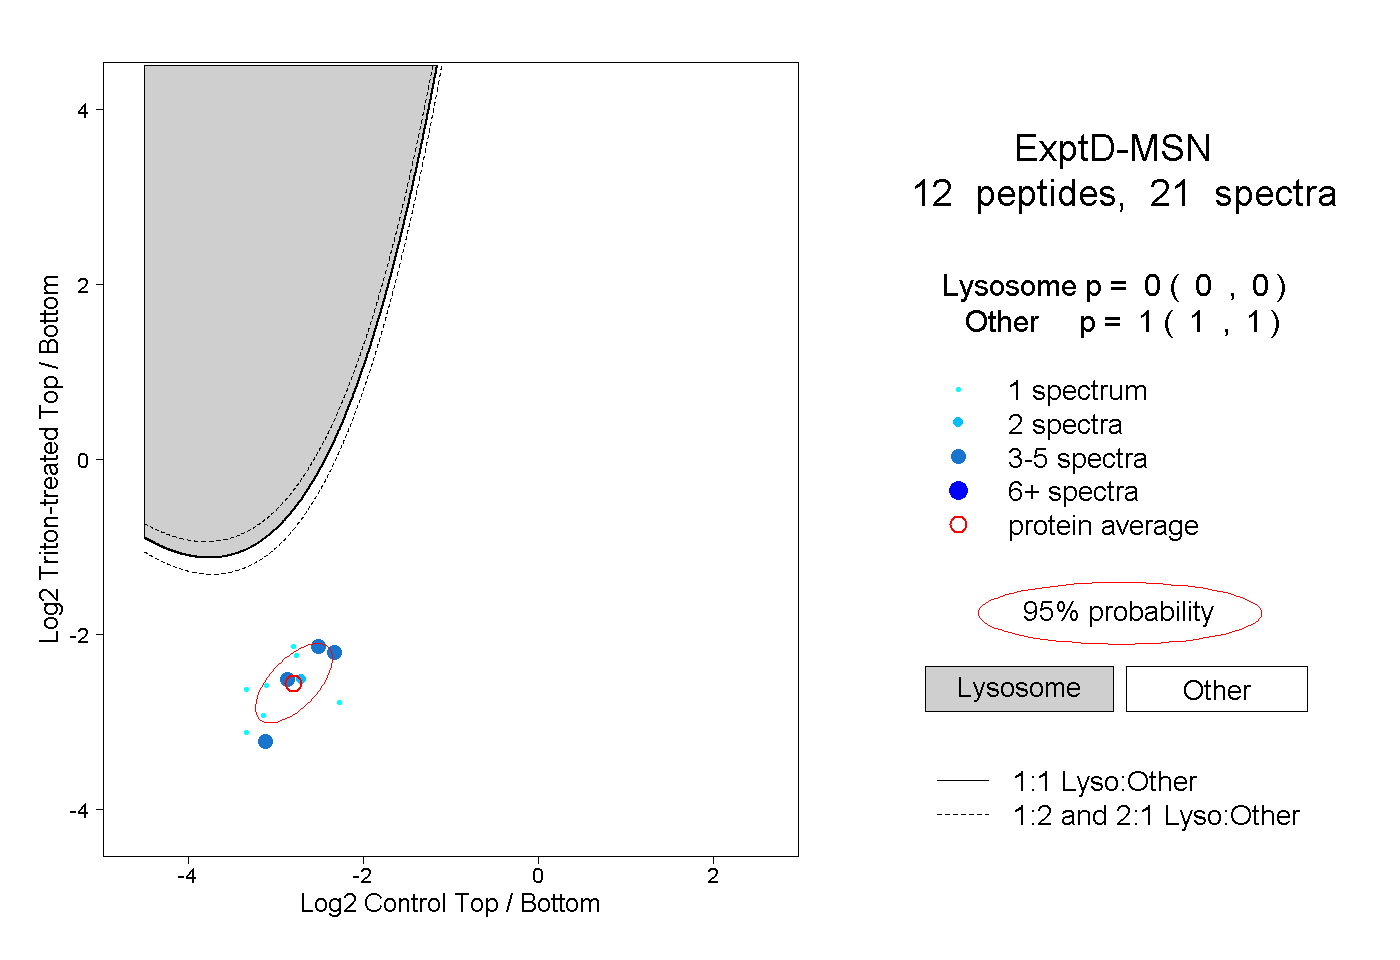
0.000 | 0.000
1.000 | 1.000