 6
6peptides
spectra
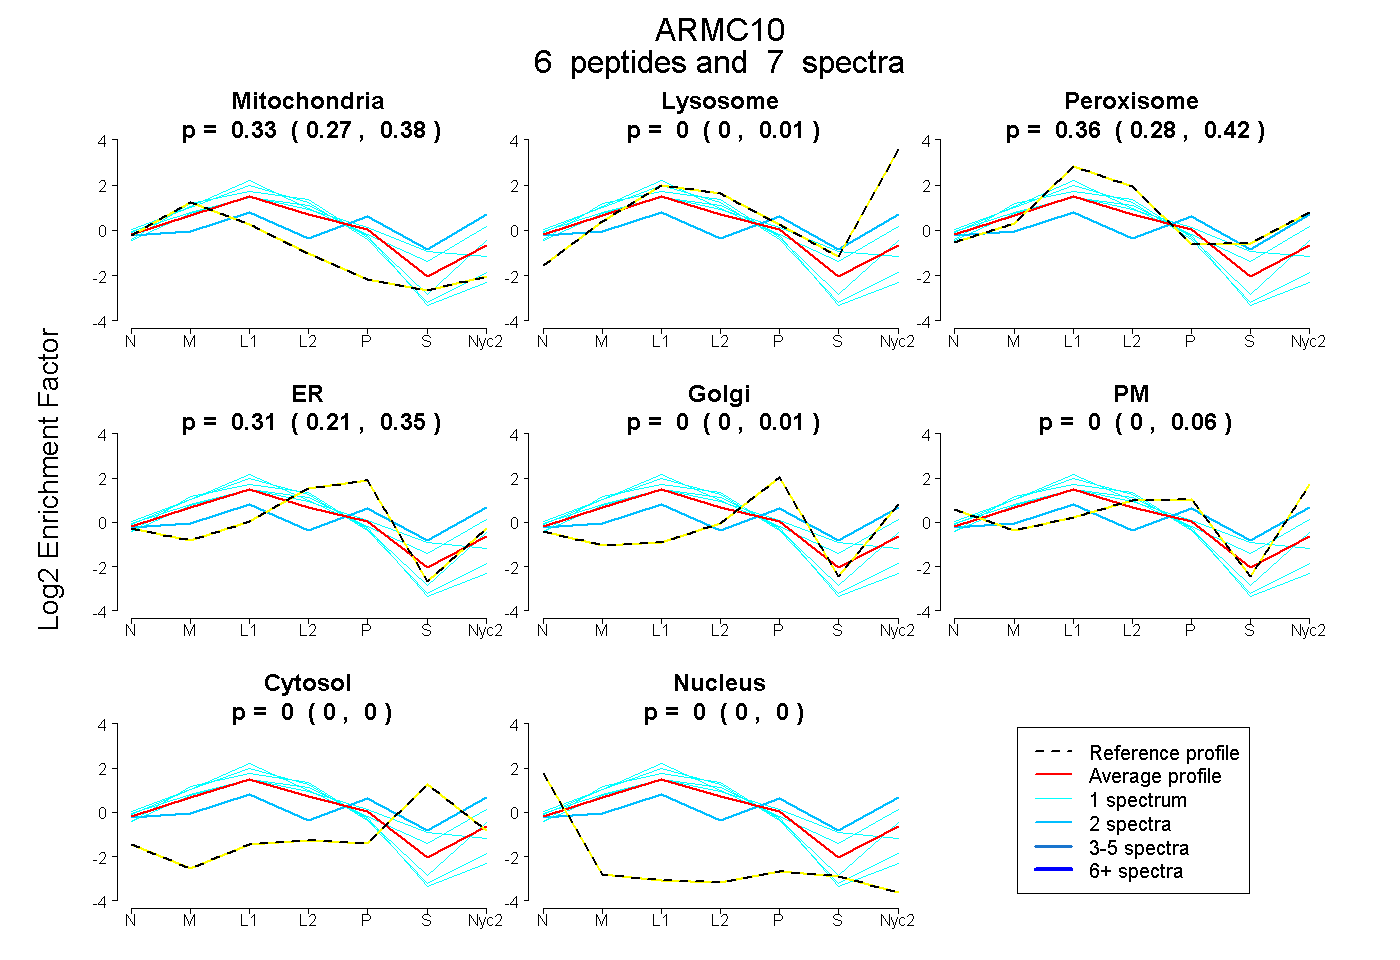
0.274 | 0.380
0.000 | 0.006
0.279 | 0.422
0.210 | 0.349
0.000 | 0.013
0.000 | 0.057
0.000 | 0.000
0.000 | 0.000
2peptides
spectra
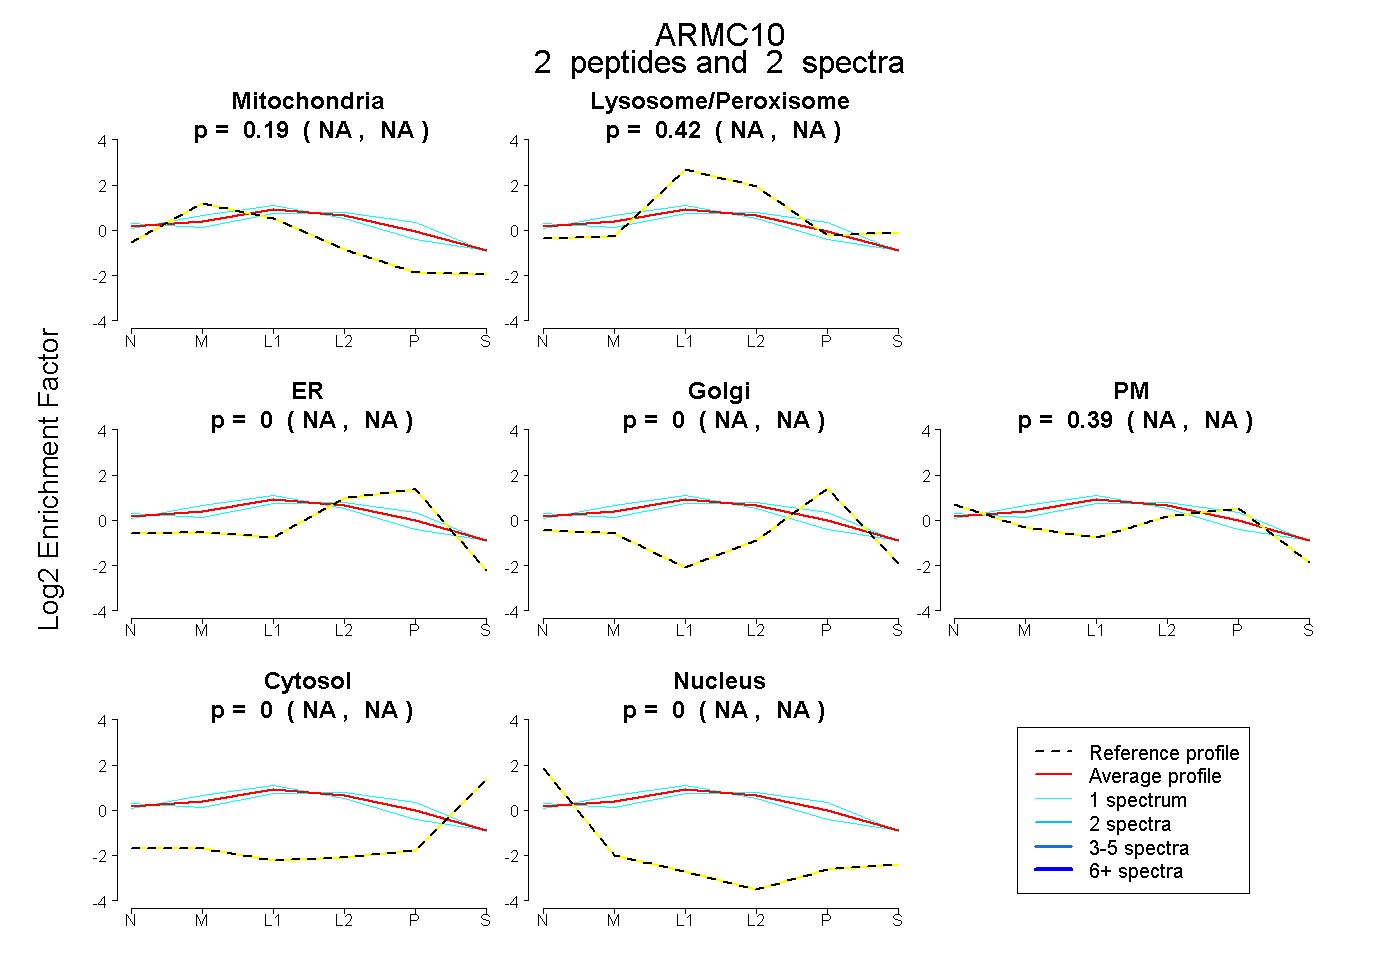
NA | NA
NA | NA
NA | NA
NA | NA
NA | NA
NA | NA
NA | NA
7peptides
spectra
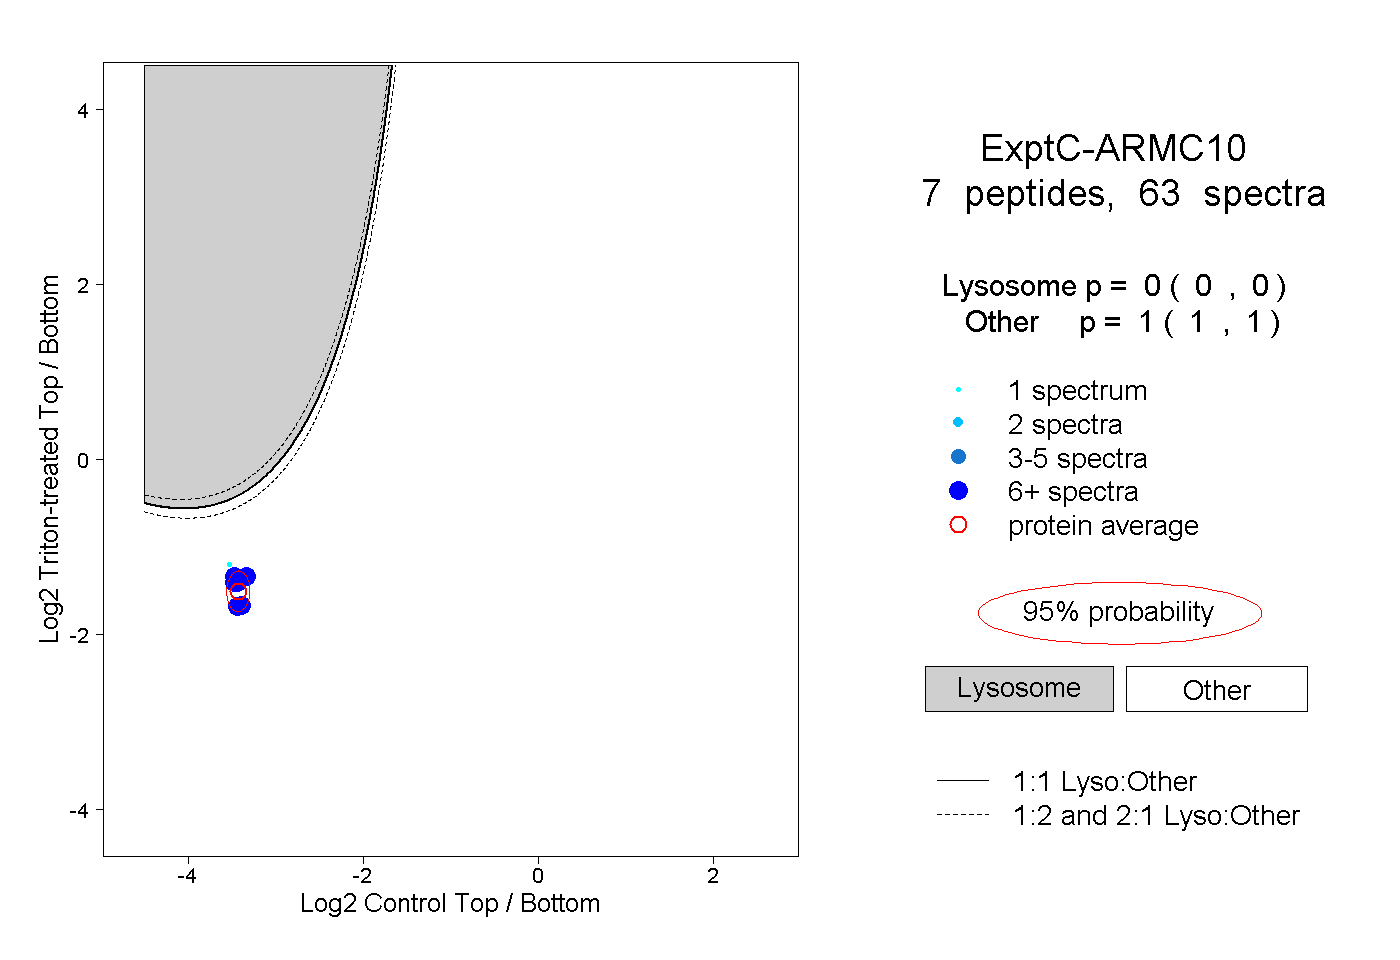
0.000 | 0.000
1.000 | 1.000
5peptides
spectra
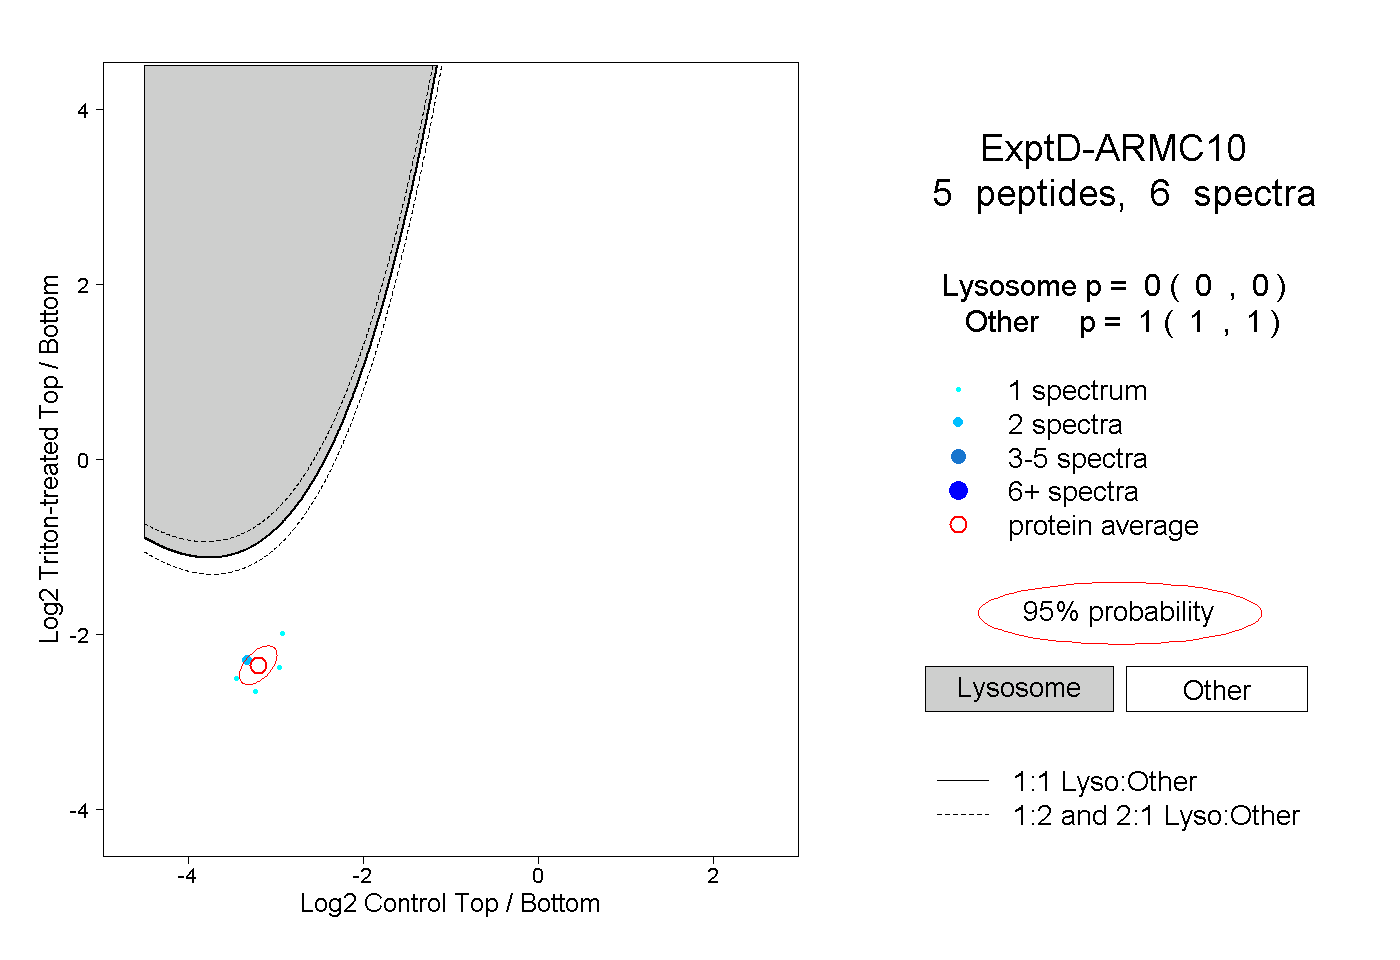
0.000 | 0.000
1.000 | 1.000