 6
6peptides
spectra
0.274 | 0.380
0.000 | 0.006
0.279 | 0.422
0.210 | 0.349
0.000 | 0.013
0.000 | 0.057
0.000 | 0.000
0.000 | 0.000
| Plot | Mito | Lyso | Perox | ER | Golgi | PM | Cytosol | Nucleus | |||||
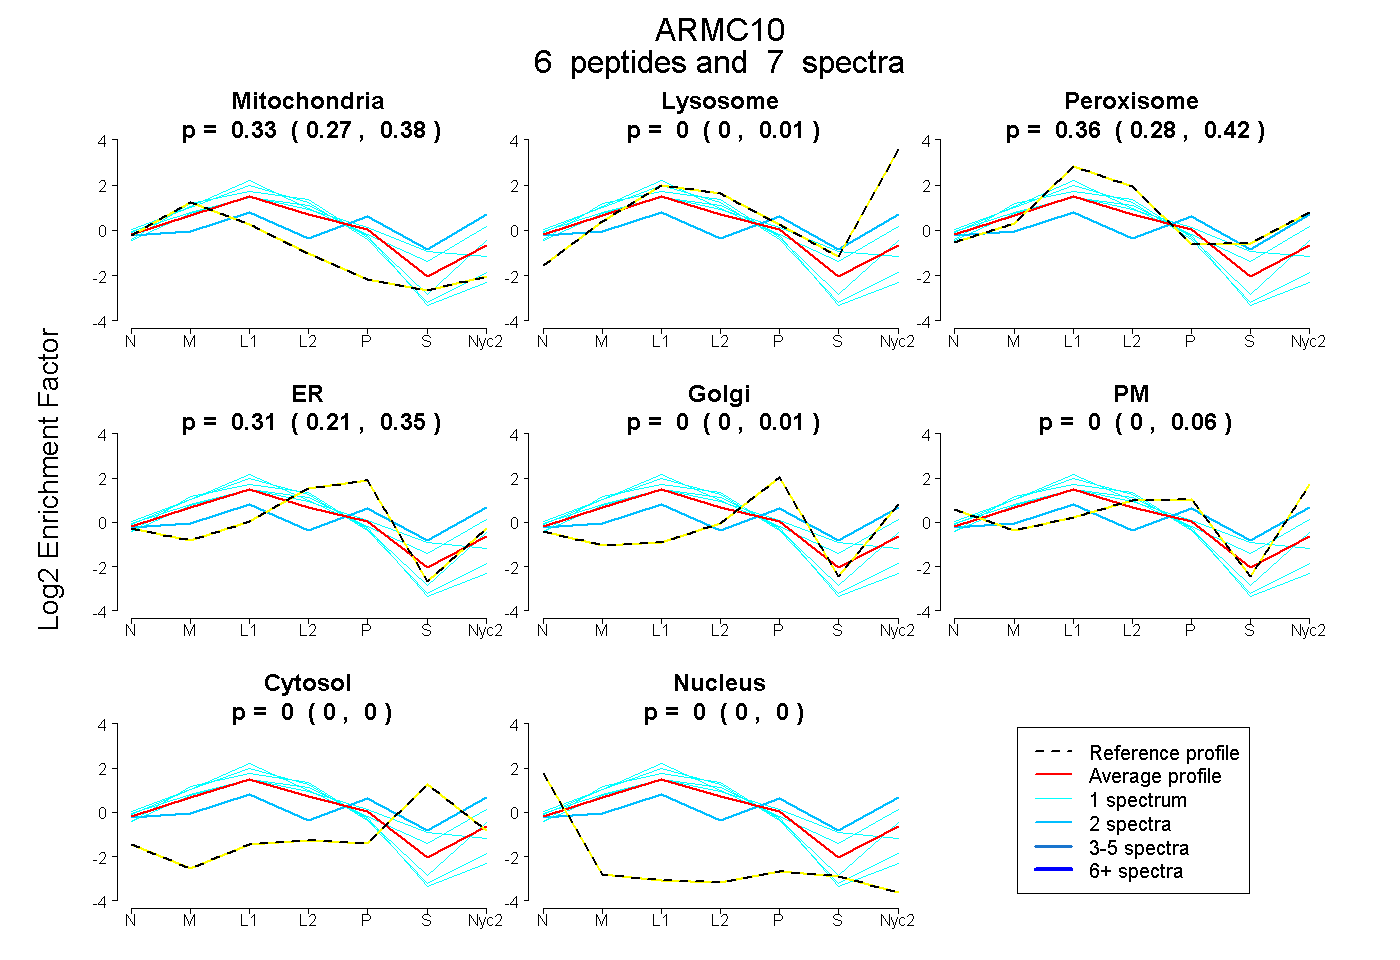
| Expt A |
6 peptides |
7 spectra |
|
0.332 0.274 | 0.380 |
0.000 0.000 | 0.006 |
0.359 0.279 | 0.422 |
0.309 0.210 | 0.349 |
0.000 0.000 | 0.013 |
0.000 0.000 | 0.057 |
0.000 0.000 | 0.000 |
0.000 0.000 | 0.000 |
| 1 spectrum, INSLNQSIK | 0.339 | 0.023 | 0.380 | 0.258 | 0.000 | 0.000 | 0.000 | 0.000 | ||
| 1 spectrum, ALACHPDVDVK | 0.290 | 0.000 | 0.454 | 0.232 | 0.000 | 0.000 | 0.024 | 0.000 | ||
| 1 spectrum, LANQLPFAK | 0.227 | 0.000 | 0.507 | 0.082 | 0.000 | 0.184 | 0.000 | 0.000 | ||
| 1 spectrum, ALTLFQNINNCLR | 0.474 | 0.000 | 0.250 | 0.277 | 0.000 | 0.000 | 0.000 | 0.000 | ||
| 1 spectrum, GSLFFLLYGEECAQK | 0.522 | 0.000 | 0.199 | 0.278 | 0.000 | 0.000 | 0.000 | 0.000 | ||
| 2 spectra, ELGGIPIVGSK | 0.105 | 0.095 | 0.284 | 0.000 | 0.386 | 0.000 | 0.129 | 0.000 |
| Plot | Mito | Lyso or Perox | ER | Golgi | PM | Cytosol | Nucleus | ||||||
| Expt B |
2 peptides |
2 spectra |
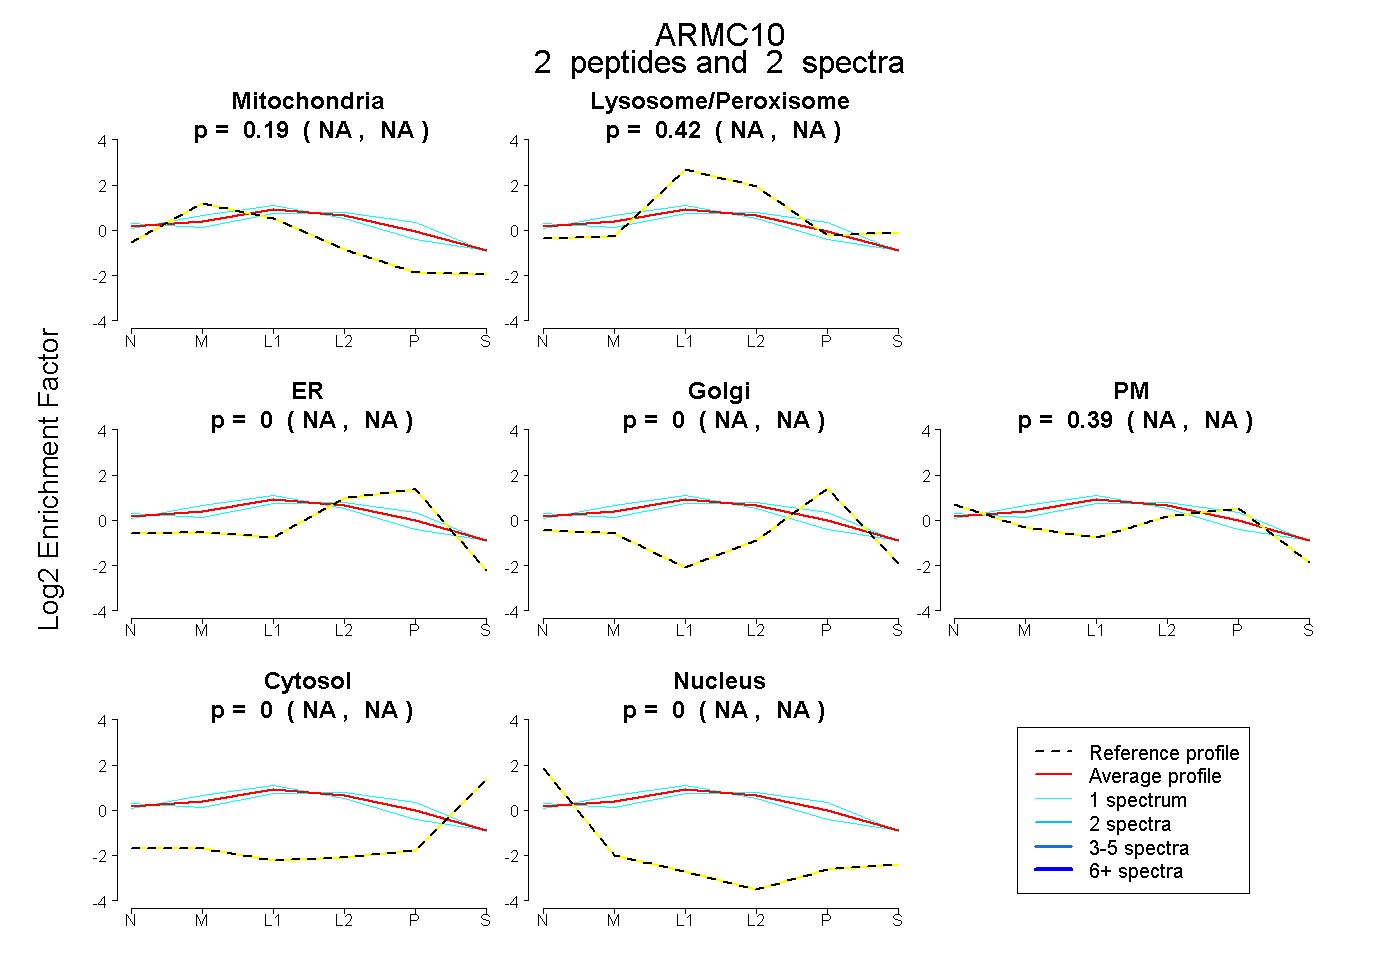 |
0.185 NA | NA |
0.421 NA | NA |
0.000 NA | NA |
0.000 NA | NA |
0.394 NA | NA |
0.000 NA | NA |
0.000 NA | NA |
|||
| Plot | Lyso | Other | |||||||||||
| Expt C |
7 peptides |
63 spectra |
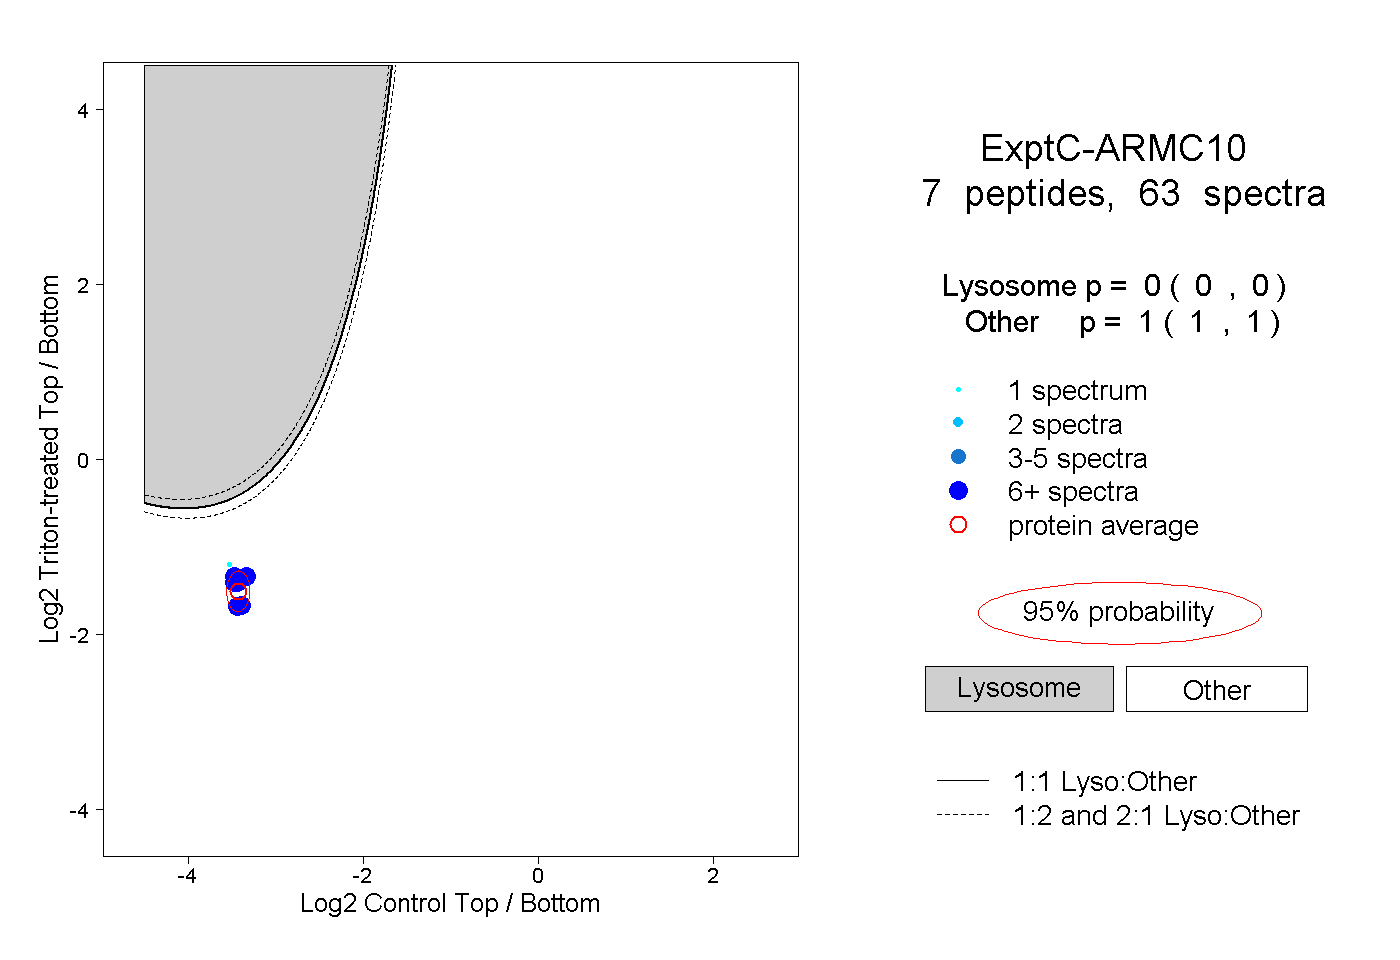 |
0.000 0.000 | 0.000 |
1.000 1.000 | 1.000 |
||||||||
| Plot | Lyso | Other | |||||||||||
| Expt D |
5 peptides |
6 spectra |
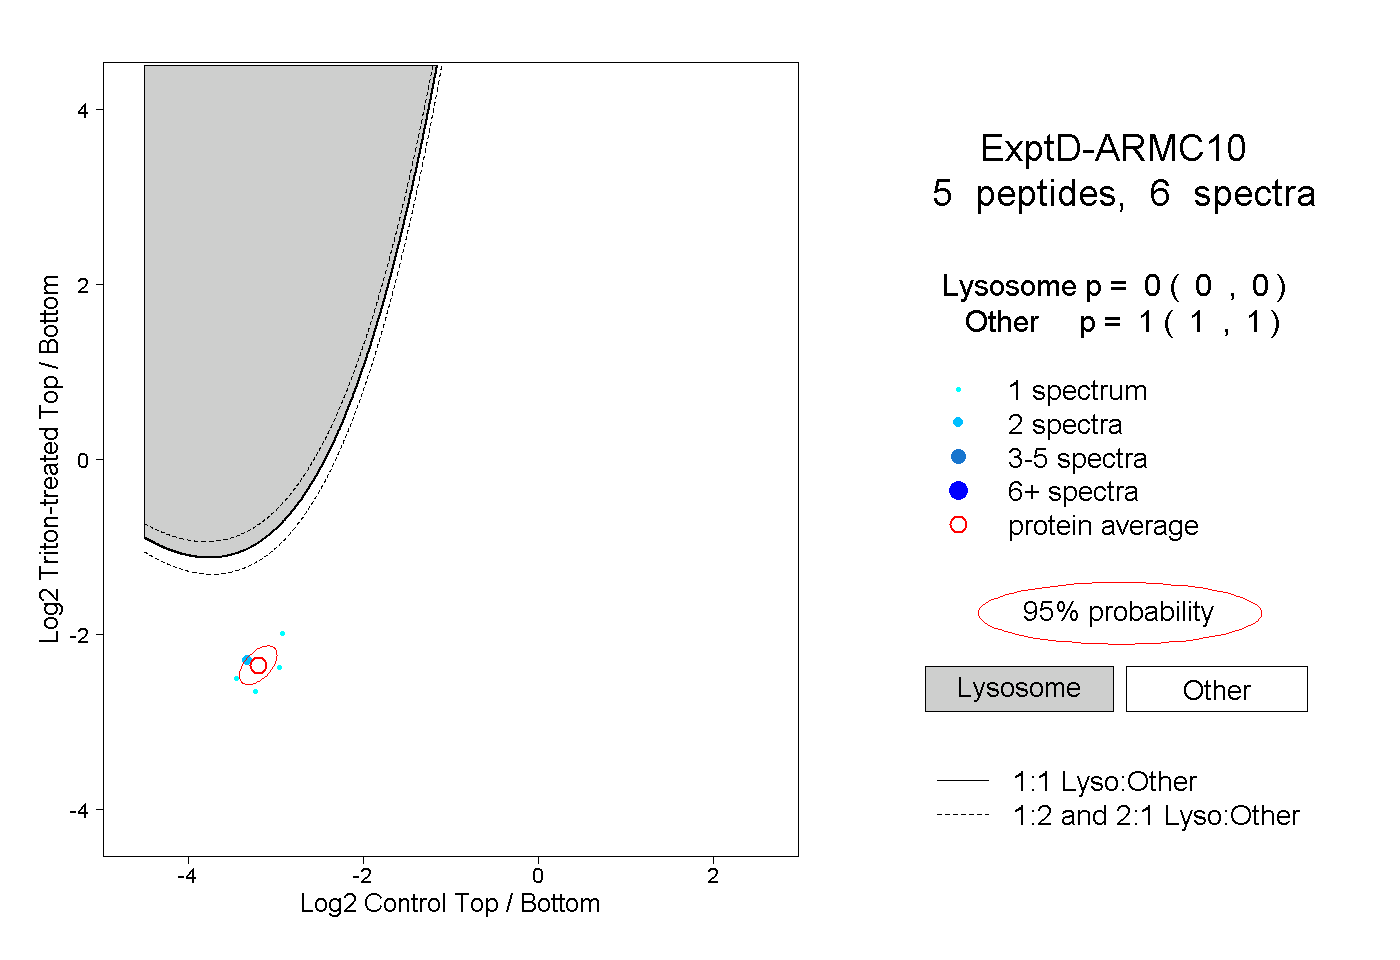 |
0.000 0.000 | 0.000 |
1.000 1.000 | 1.000 |