 5
5peptides
spectra

0.000 | 0.051
0.000 | 0.097
0.011 | 0.108
0.000 | 0.001
0.000 | 0.009
0.000 | 0.068
0.809 | 0.874
0.000 | 0.000
1peptide
spectrum
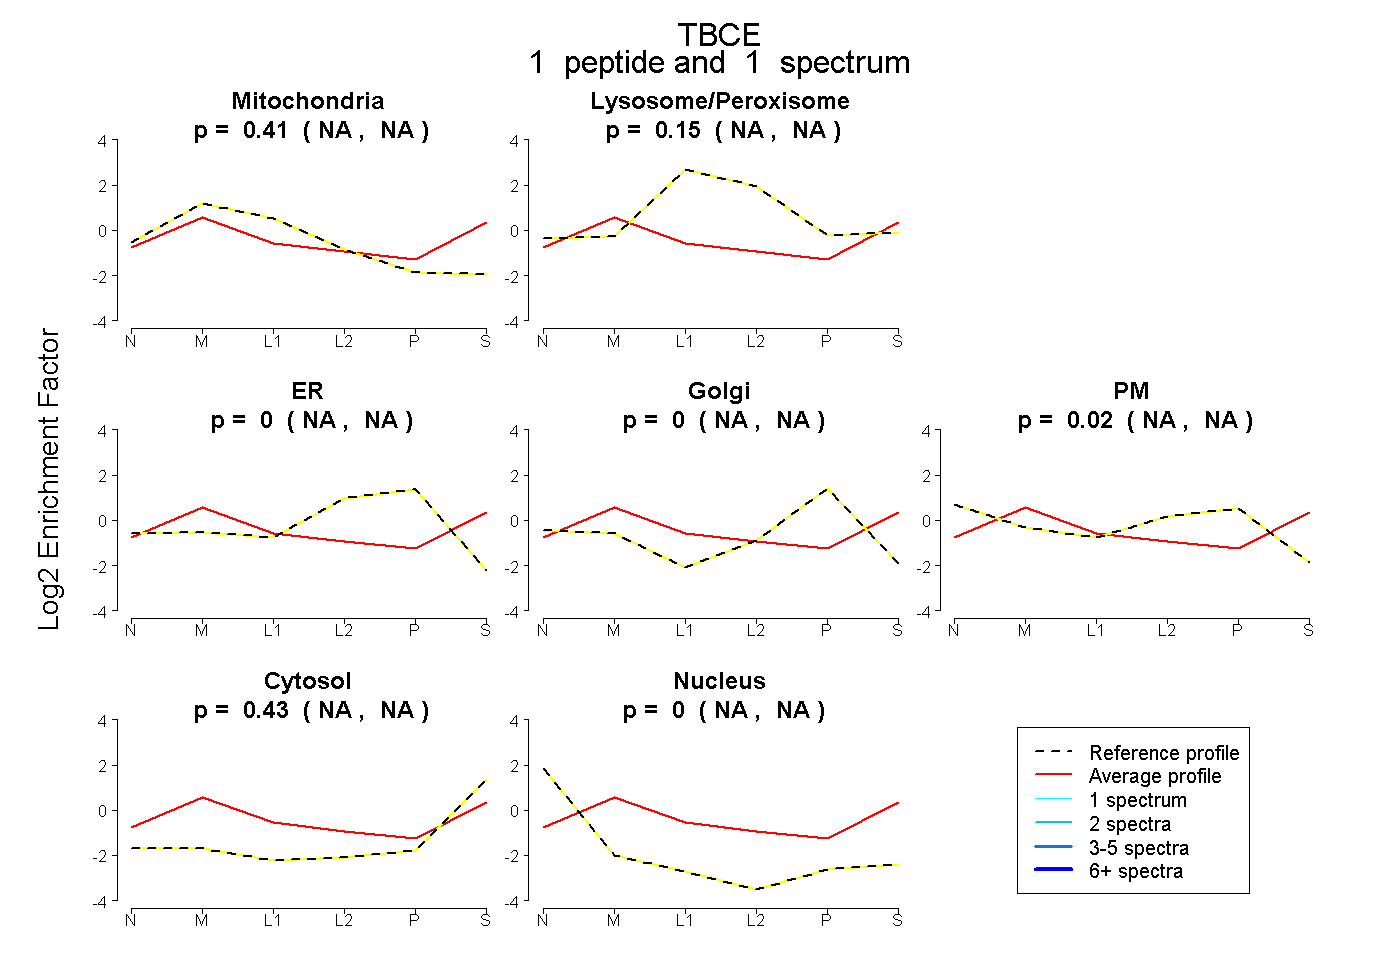
NA | NA
NA | NA
NA | NA
NA | NA
NA | NA
NA | NA
NA | NA
3peptides
spectra
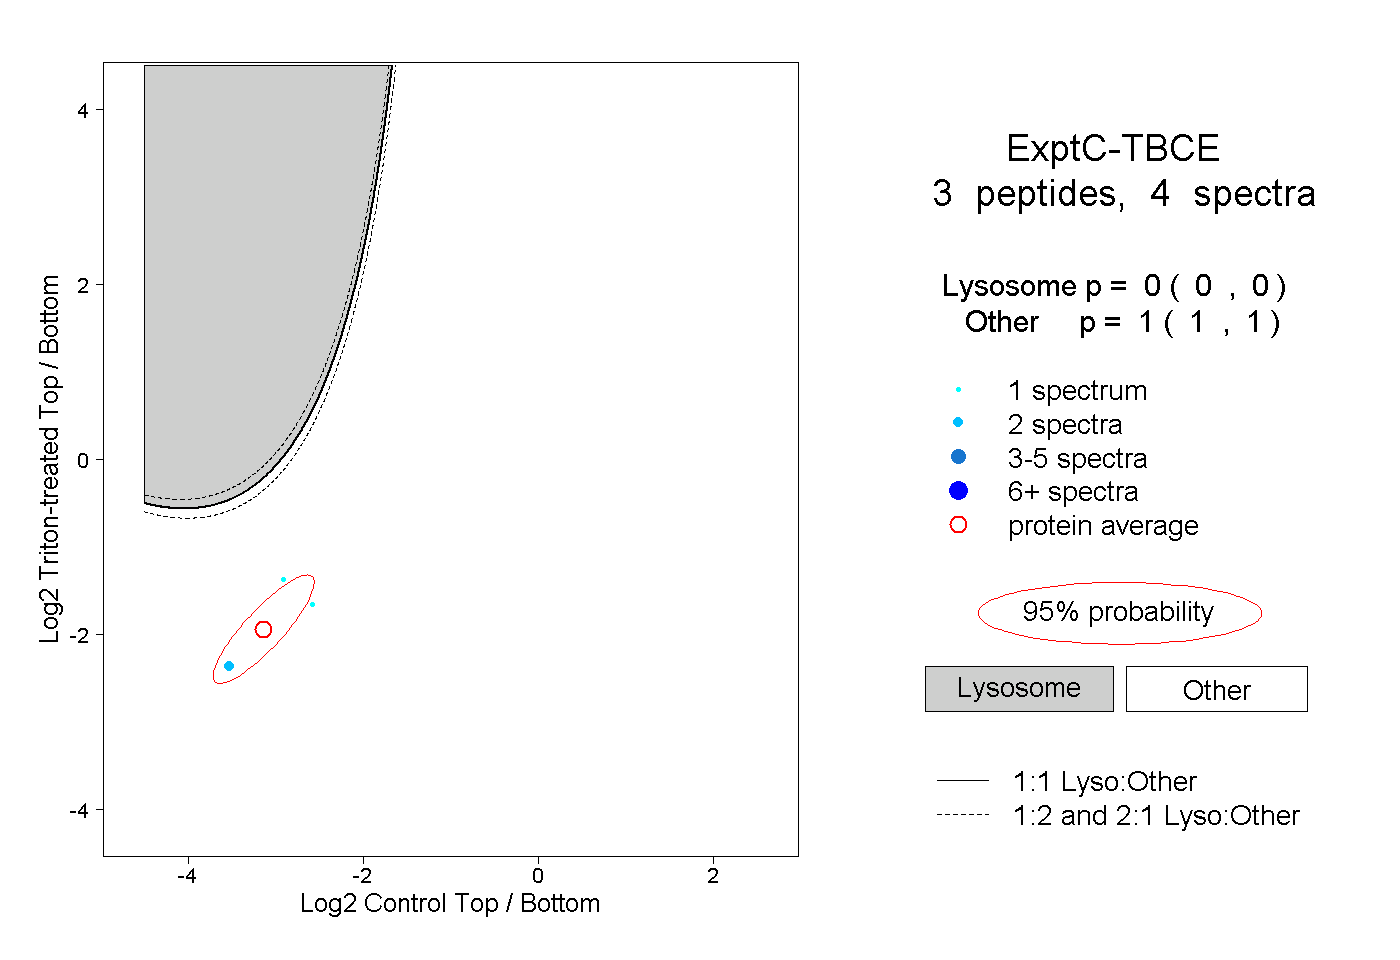
0.000 | 0.000
1.000 | 1.000