 5
5peptides
spectra

0.000 | 0.051
0.000 | 0.097
0.011 | 0.108
0.000 | 0.001
0.000 | 0.009
0.000 | 0.068
0.809 | 0.874
0.000 | 0.000
| Plot | Mito | Lyso | Perox | ER | Golgi | PM | Cytosol | Nucleus | |||||
| Expt A |
5 peptides |
9 spectra |
|
0.006 0.000 | 0.051 |
0.041 0.000 | 0.097 |
0.073 0.011 | 0.108 |
0.000 0.000 | 0.001 |
0.000 0.000 | 0.009 |
0.030 0.000 | 0.068 |
0.851 0.809 | 0.874 |
0.000 0.000 | 0.000 |
| 1 spectrum, CSNQPEQQILEK | 0.158 | 0.000 | 0.060 | 0.176 | 0.000 | 0.000 | 0.605 | 0.000 | ||
| 3 spectra, VPVSELLLSYESSK | 0.040 | 0.133 | 0.077 | 0.000 | 0.000 | 0.000 | 0.750 | 0.000 | ||
| 2 spectra, CQILPEER | 0.000 | 0.014 | 0.073 | 0.000 | 0.000 | 0.115 | 0.798 | 0.000 | ||
| 1 spectrum, IAEACPNIR | 0.000 | 0.076 | 0.106 | 0.000 | 0.000 | 0.002 | 0.816 | 0.000 | ||
| 2 spectra, DLEALDLSENK | 0.000 | 0.000 | 0.000 | 0.000 | 0.000 | 0.000 | 1.000 | 0.000 |
| Plot | Mito | Lyso or Perox | ER | Golgi | PM | Cytosol | Nucleus | ||||||
| Expt B |
1 peptide |
1 spectrum |
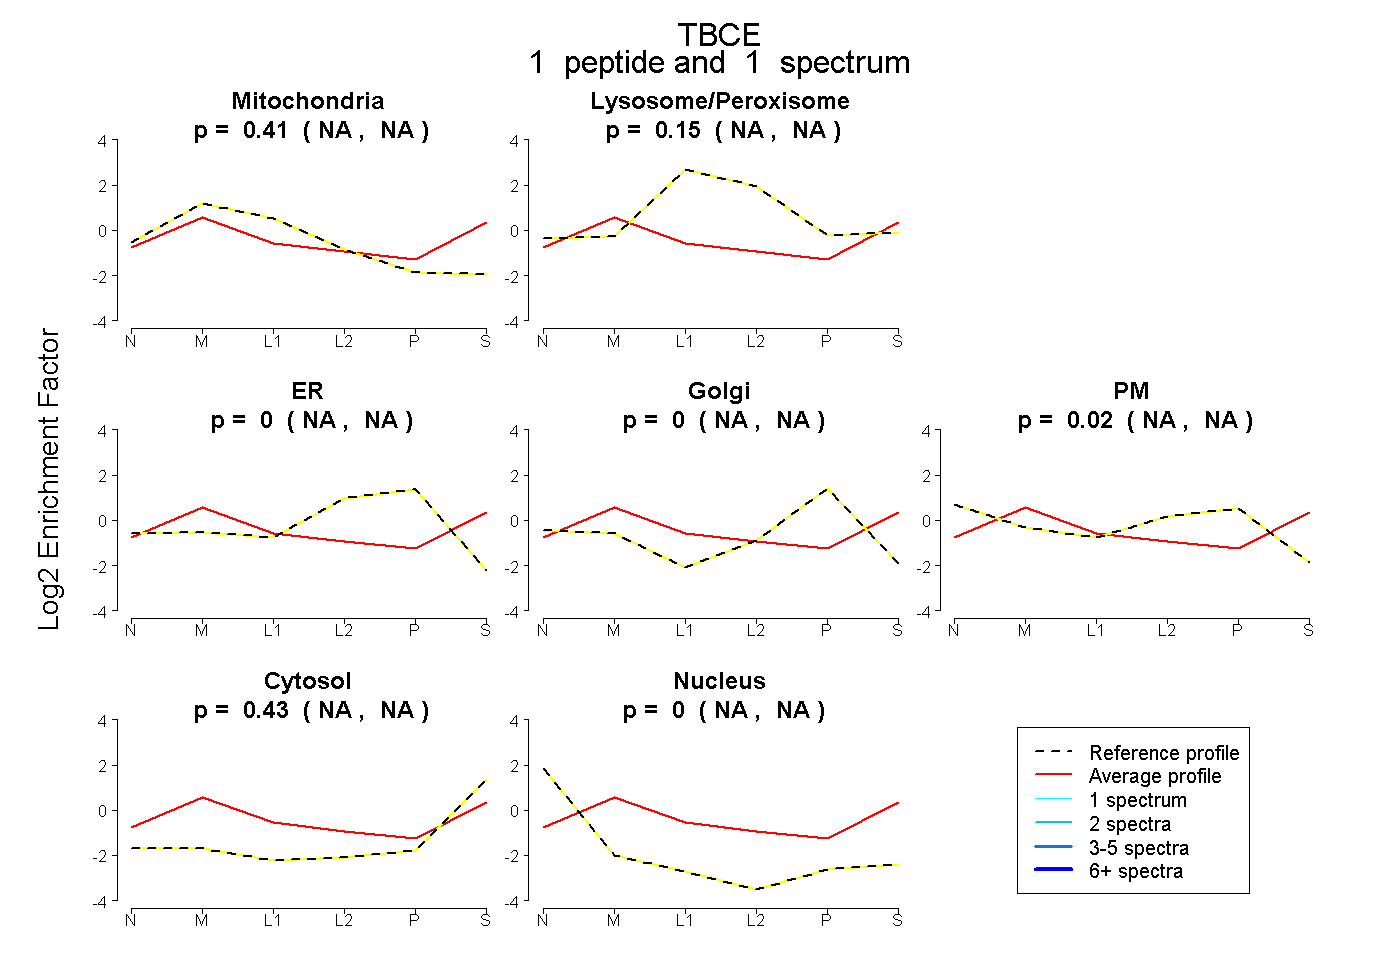 |
0.408 NA | NA |
0.146 NA | NA |
0.000 NA | NA |
0.000 NA | NA |
0.016 NA | NA |
0.429 NA | NA |
0.000 NA | NA |
|||
| Plot | Lyso | Other | |||||||||||
| Expt C |
3 peptides |
4 spectra |
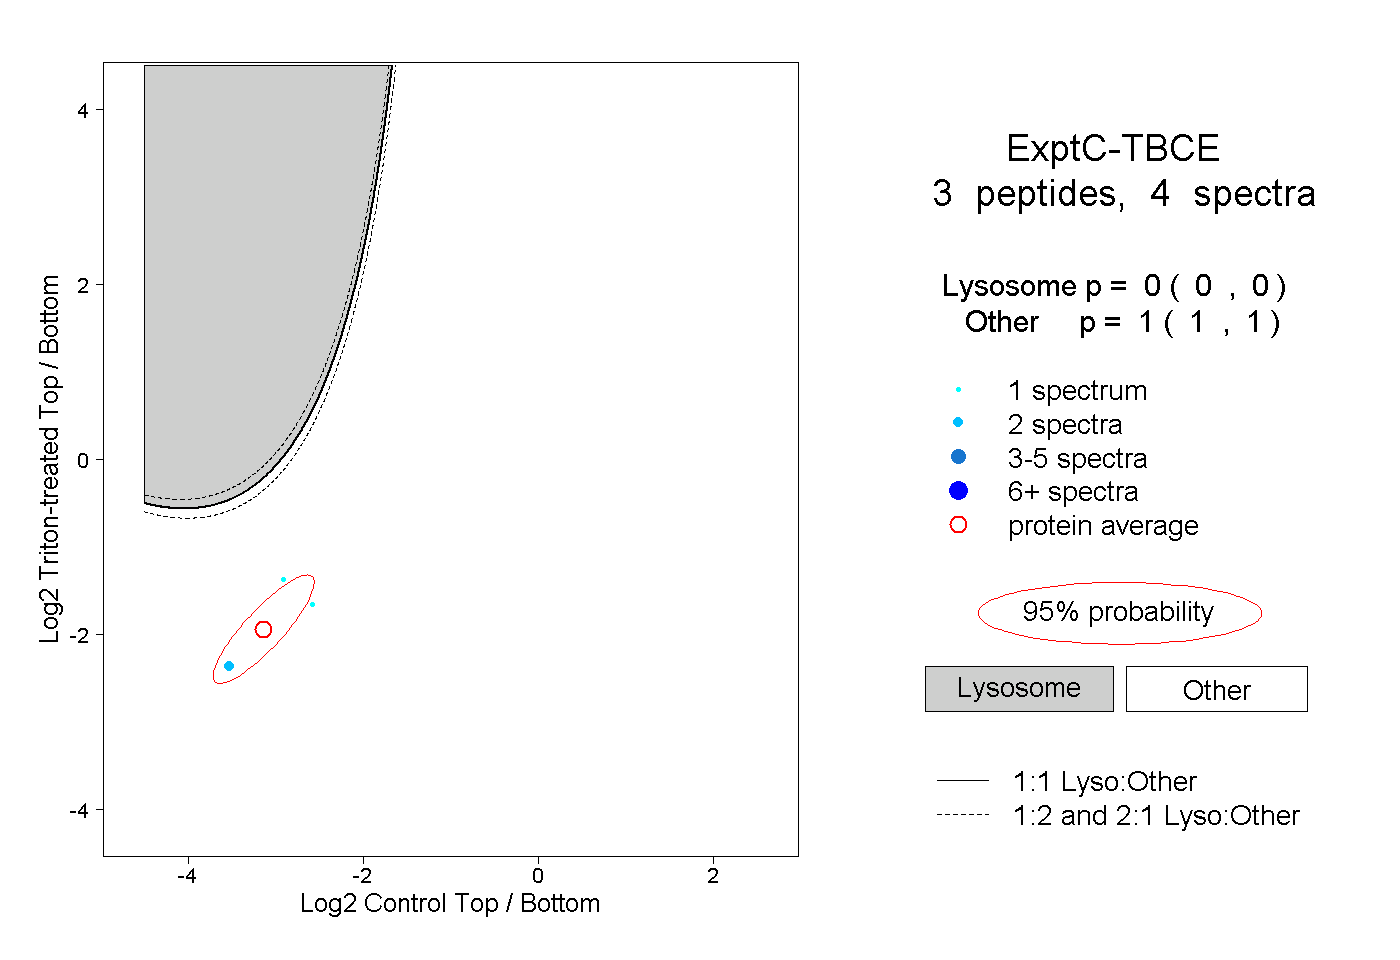 |
0.000 0.000 | 0.000 |
1.000 1.000 | 1.000 |