 2
2peptides
spectra
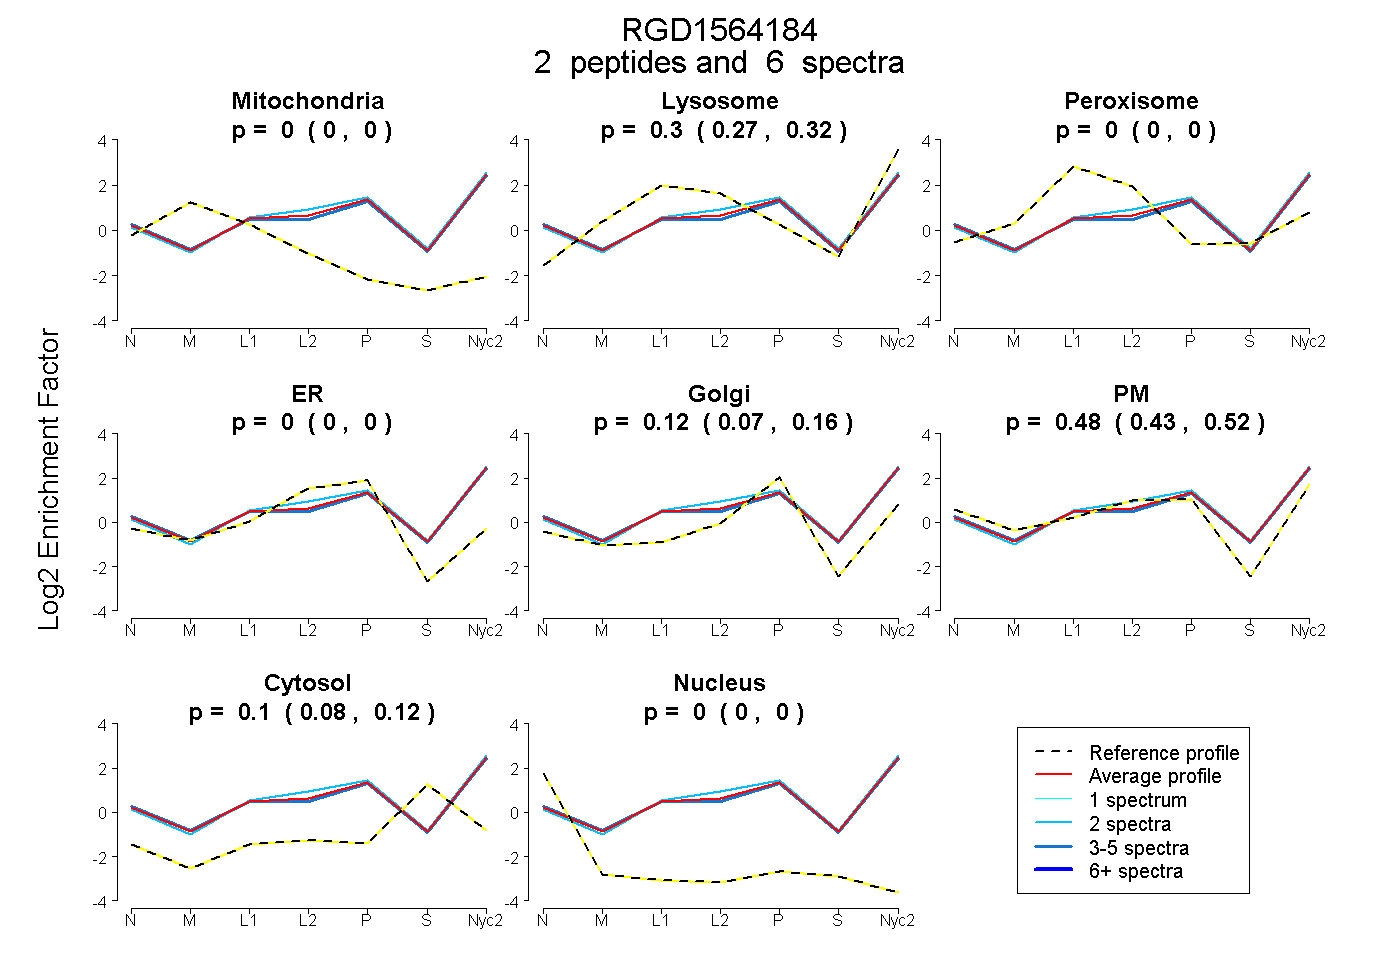
0.000 | 0.000
0.272 | 0.324
0.000 | 0.000
0.000 | 0.000
0.072 | 0.155
0.433 | 0.524
0.078 | 0.120
0.000 | 0.000
1peptide
spectrum
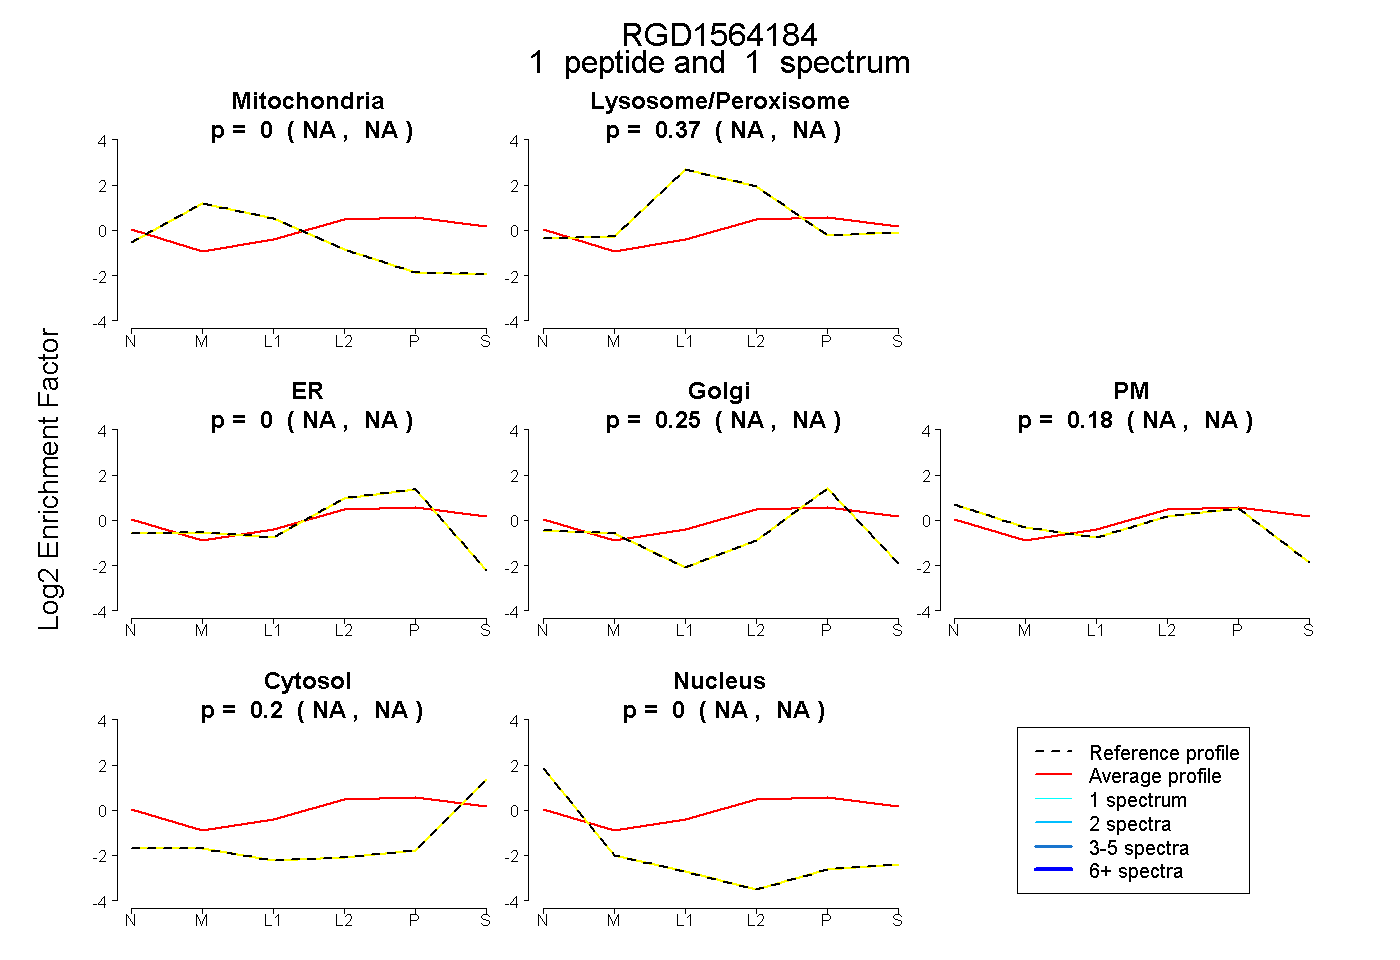
NA | NA
NA | NA
NA | NA
NA | NA
NA | NA
NA | NA
NA | NA
1peptide
spectra
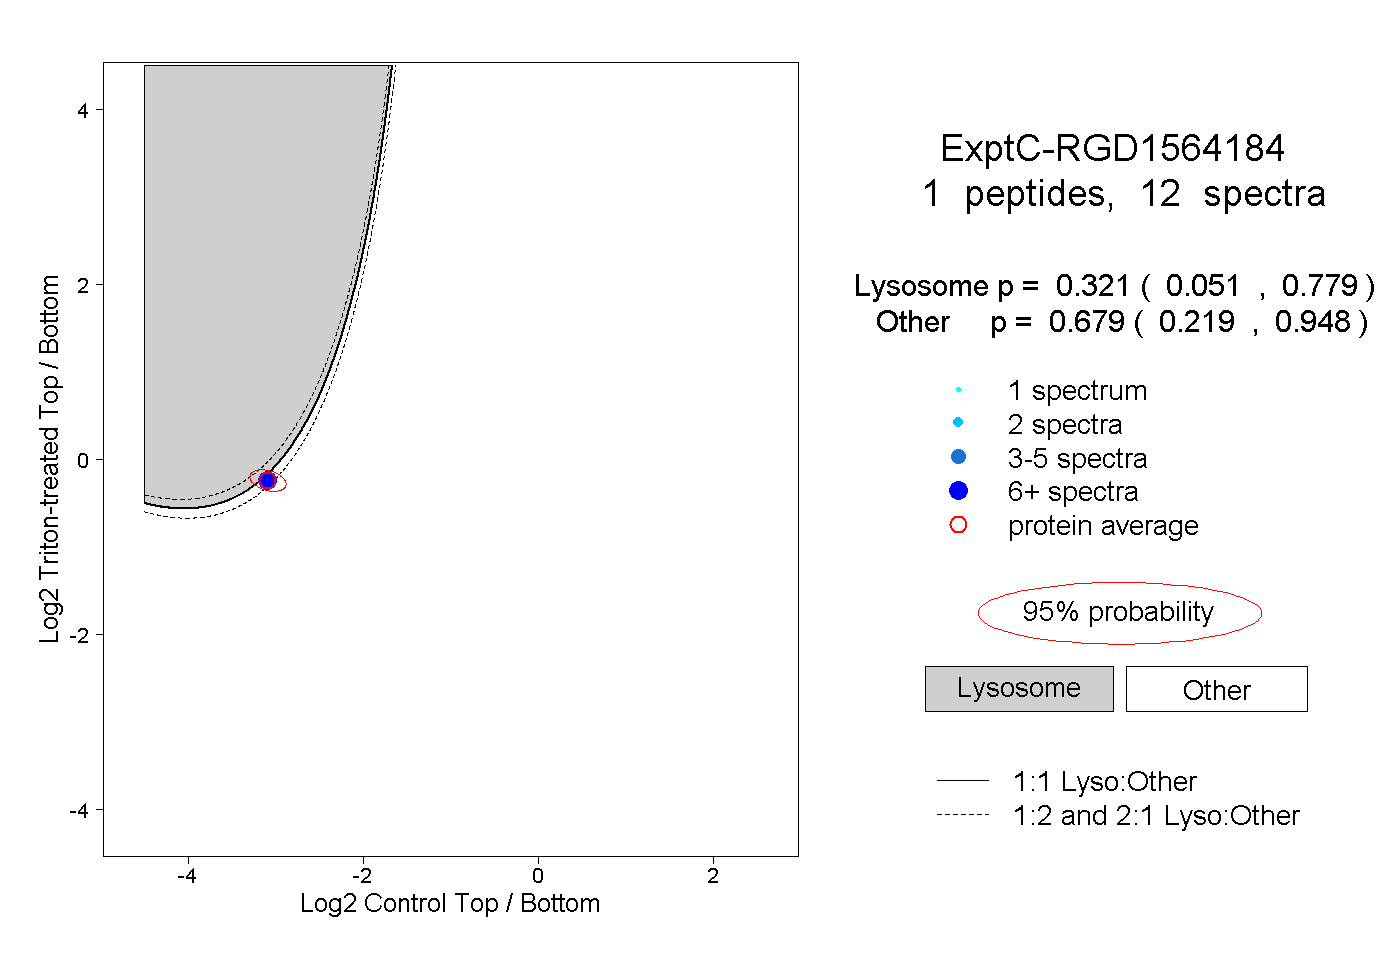
0.051 | 0.779
0.219 | 0.948