 2
2peptides
spectra
0.000 | 0.000
0.272 | 0.324
0.000 | 0.000
0.000 | 0.000
0.072 | 0.155
0.433 | 0.524
0.078 | 0.120
0.000 | 0.000
| Plot | Mito | Lyso | Perox | ER | Golgi | PM | Cytosol | Nucleus | |||||
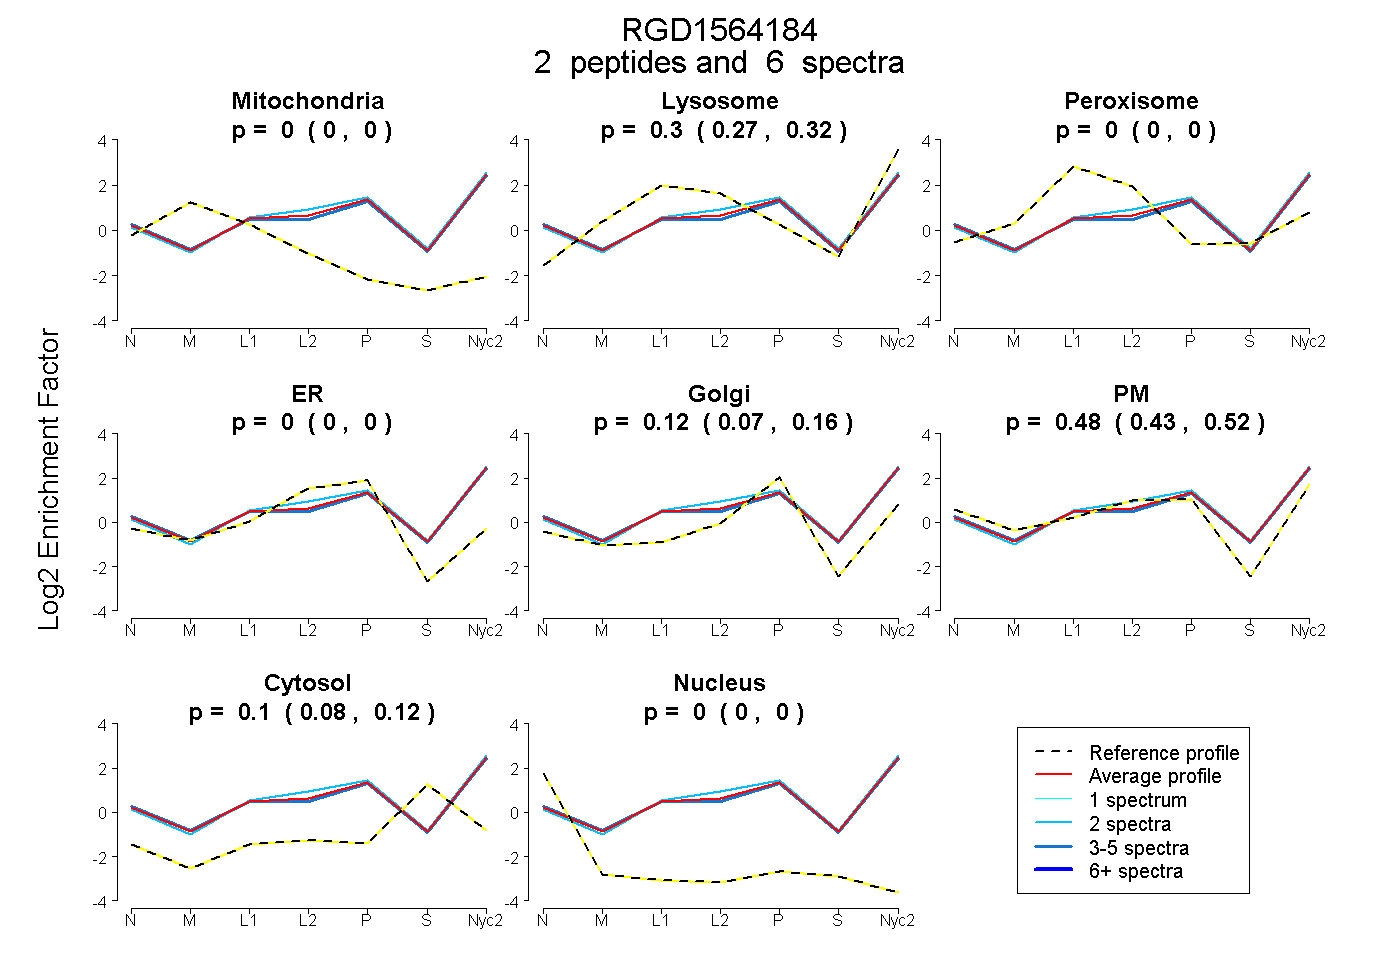
| Expt A |
2 peptides |
6 spectra |
|
0.000 0.000 | 0.000 |
0.301 0.272 | 0.324 |
0.000 0.000 | 0.000 |
0.000 0.000 | 0.000 |
0.117 0.072 | 0.155 |
0.481 0.433 | 0.524 |
0.101 0.078 | 0.120 |
0.000 0.000 | 0.000 |
| 4 spectra, LLIYYASNR | 0.000 | 0.280 | 0.000 | 0.000 | 0.107 | 0.506 | 0.108 | 0.000 | ||
| 2 spectra, SMSISVGDR | 0.000 | 0.343 | 0.000 | 0.000 | 0.138 | 0.432 | 0.087 | 0.000 |
| Plot | Mito | Lyso or Perox | ER | Golgi | PM | Cytosol | Nucleus | ||||||
| Expt B |
1 peptide |
1 spectrum |
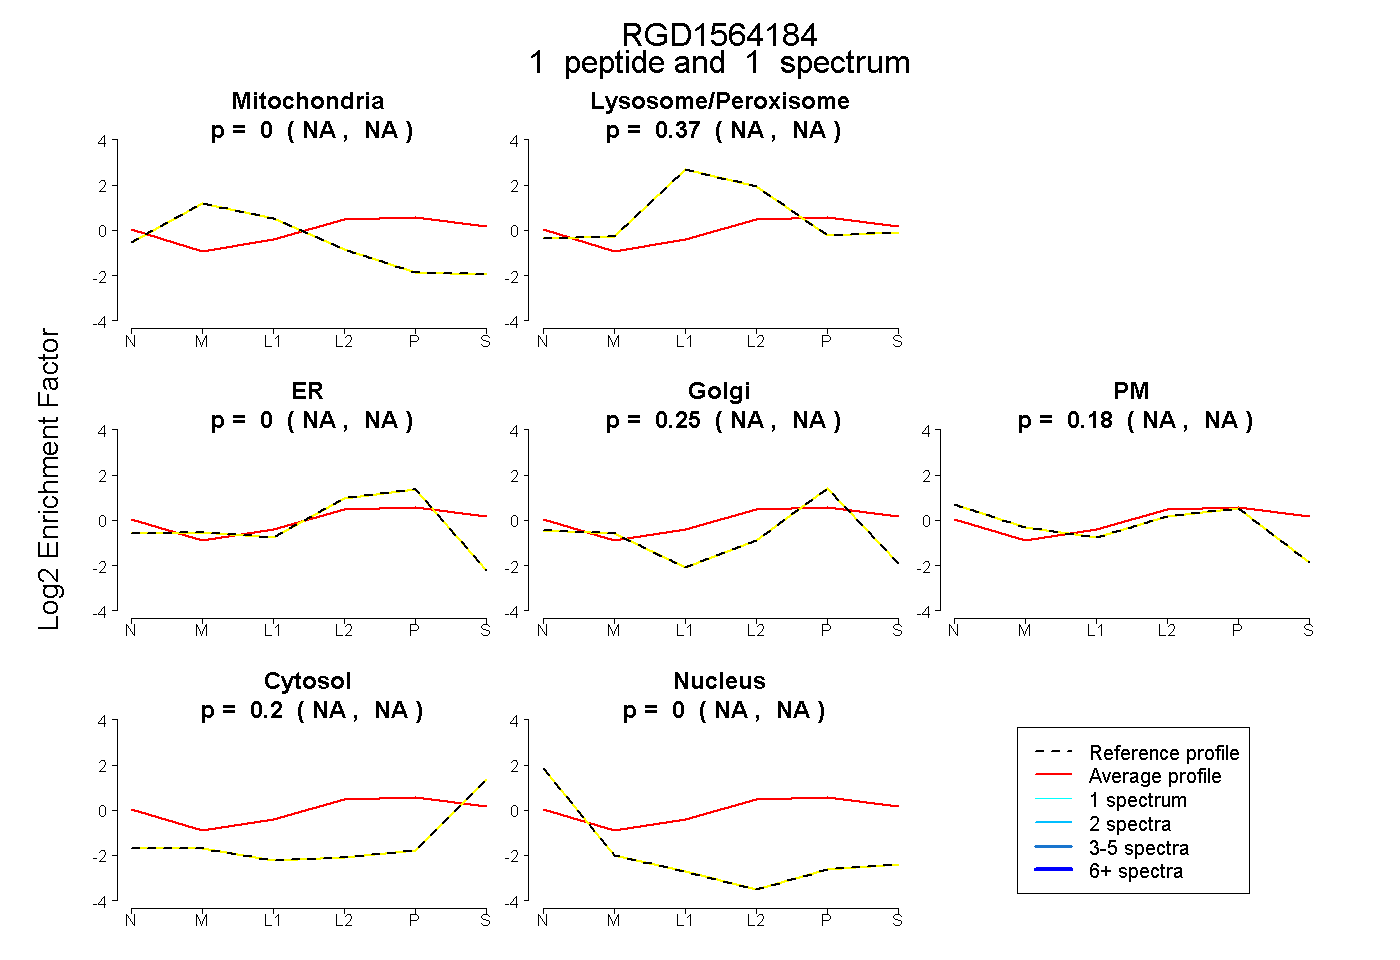 |
0.000 NA | NA |
0.374 NA | NA |
0.000 NA | NA |
0.249 NA | NA |
0.179 NA | NA |
0.198 NA | NA |
0.000 NA | NA |
|||
| Plot | Lyso | Other | |||||||||||
| Expt C |
1 peptide |
12 spectra |
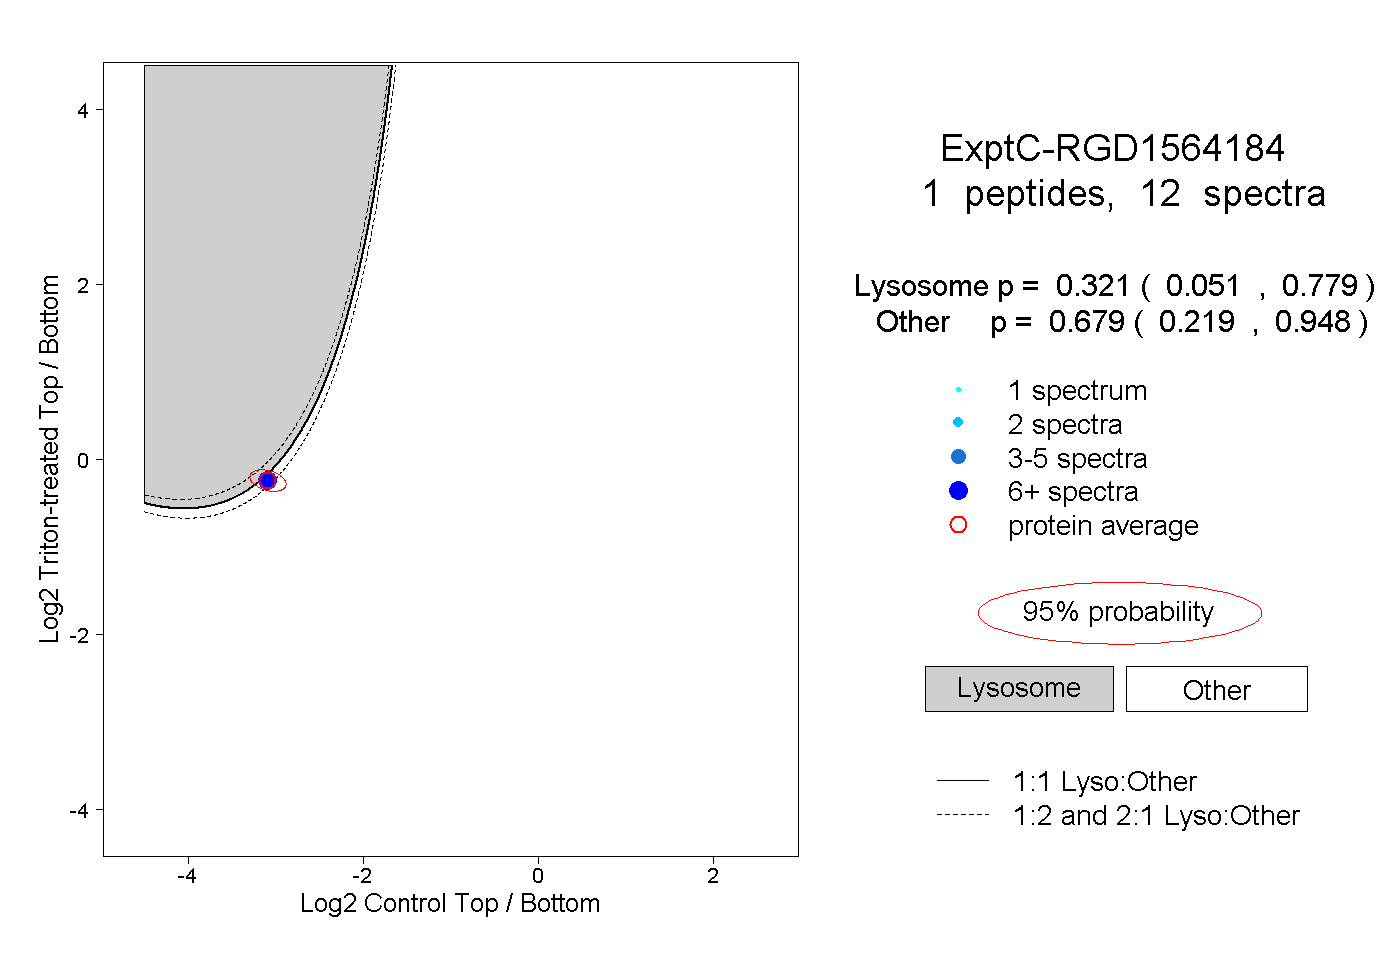 |
0.321 0.051 | 0.779 |
0.679 0.219 | 0.948 |