 3
3peptides
spectra
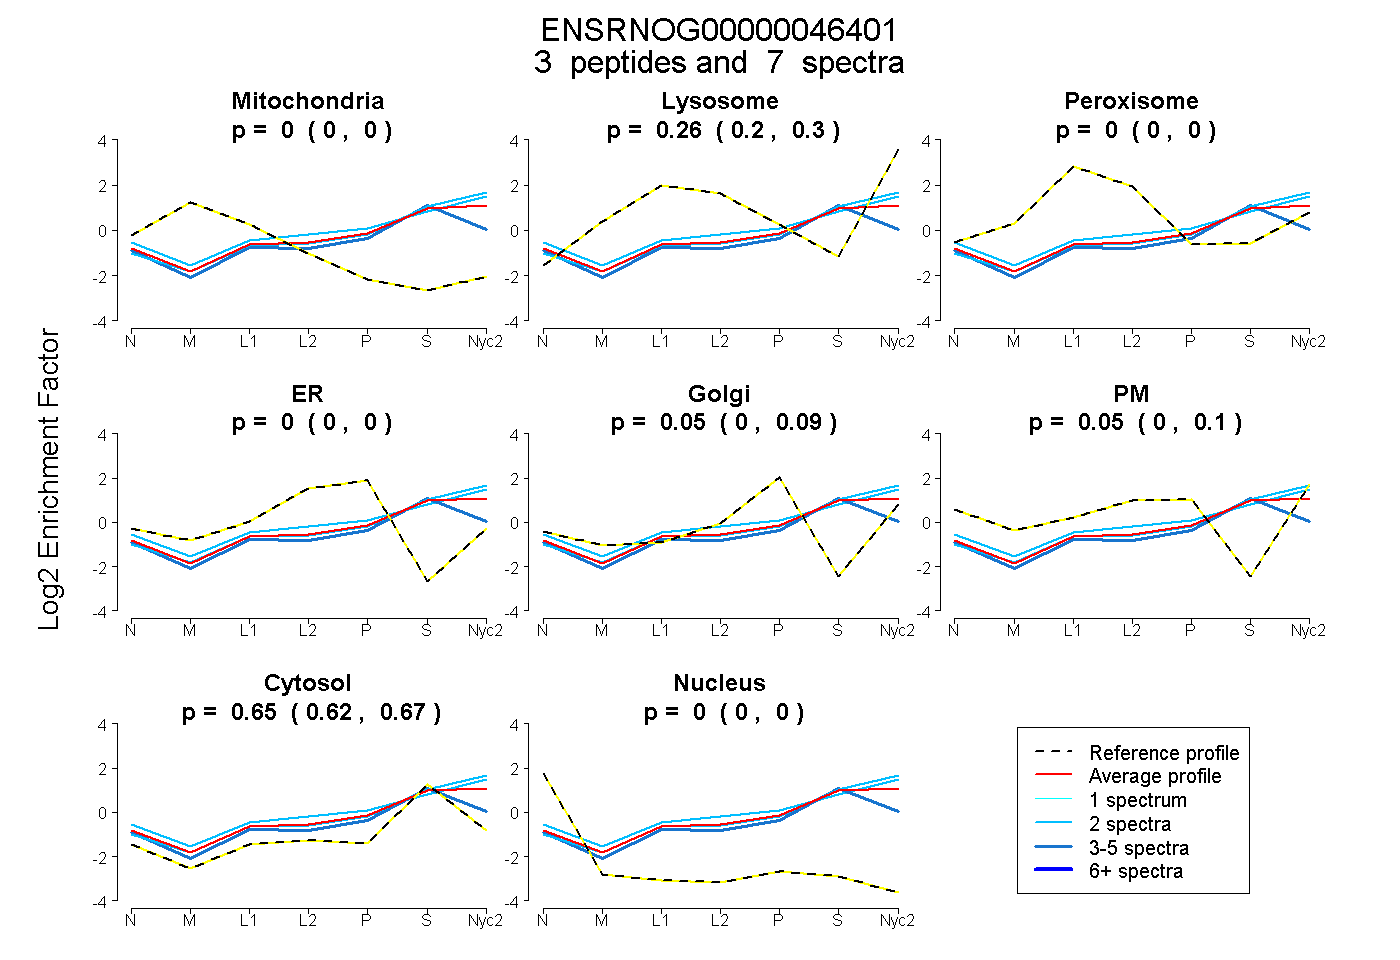
0.000 | 0.000
0.196 | 0.301
0.000 | 0.000
0.000 | 0.000
0.000 | 0.092
0.000 | 0.103
0.620 | 0.669
0.000 | 0.000
3peptides
spectra
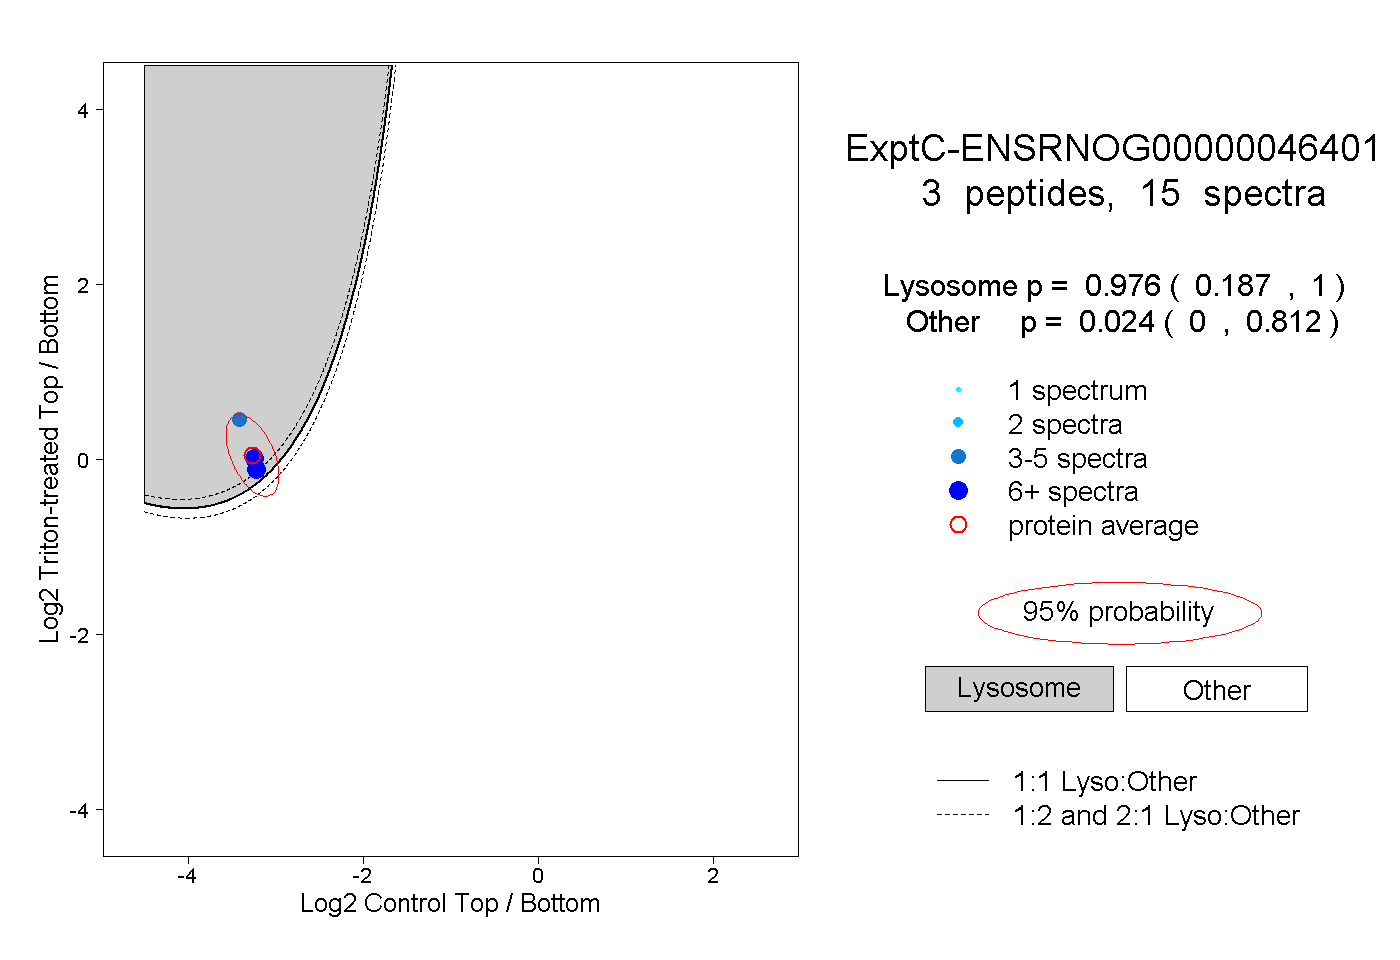
0.187 | 1.000
0.000 | 0.812
1peptide
spectrum
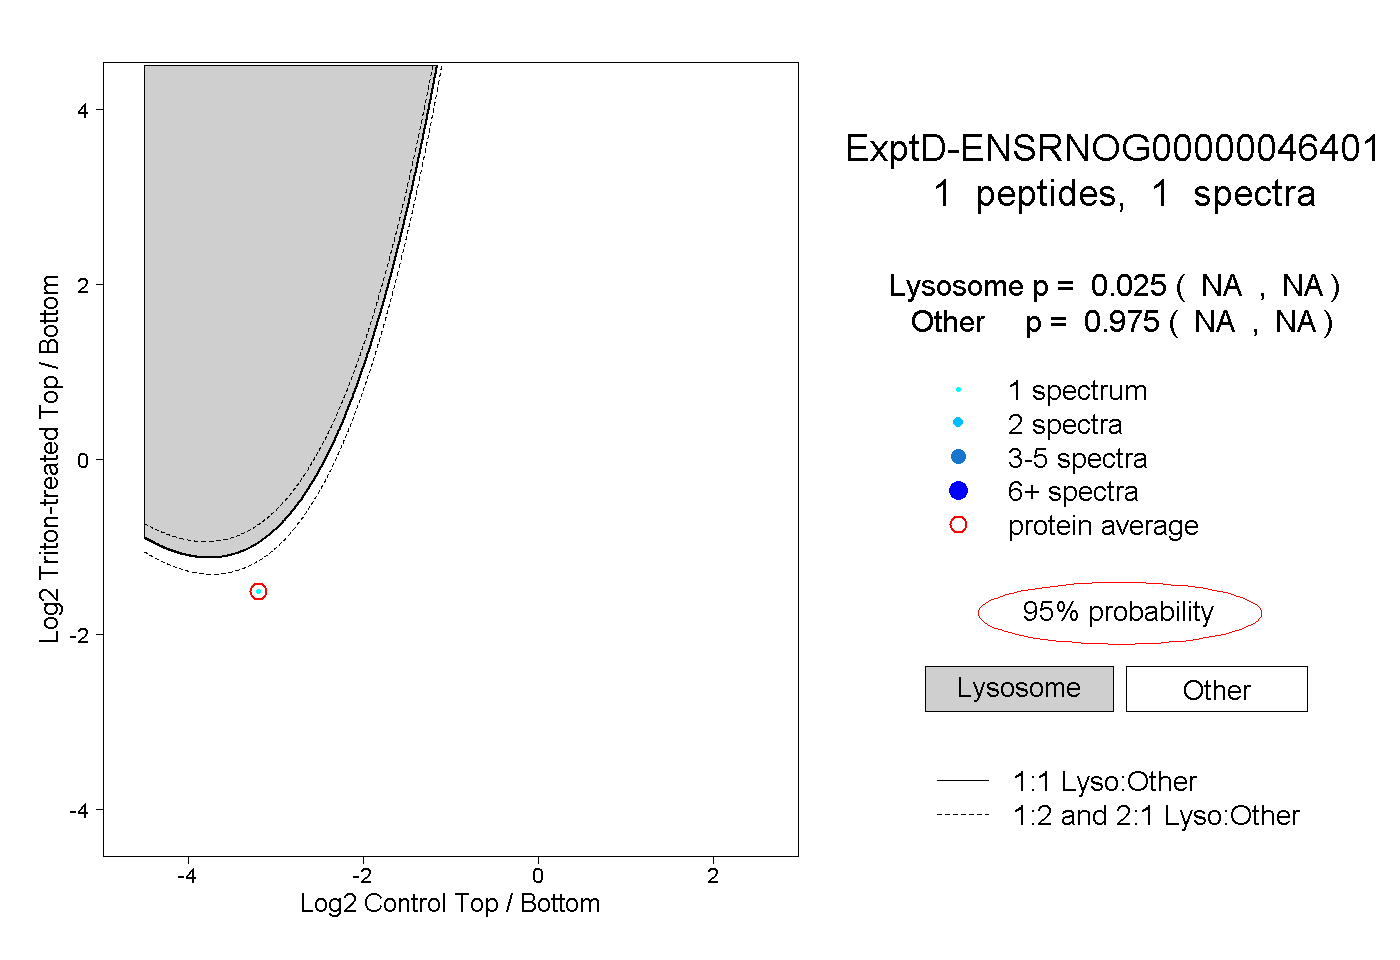
NA | NA
NA | NA