 3
3peptides
spectra
0.000 | 0.000
0.196 | 0.301
0.000 | 0.000
0.000 | 0.000
0.000 | 0.092
0.000 | 0.103
0.620 | 0.669
0.000 | 0.000
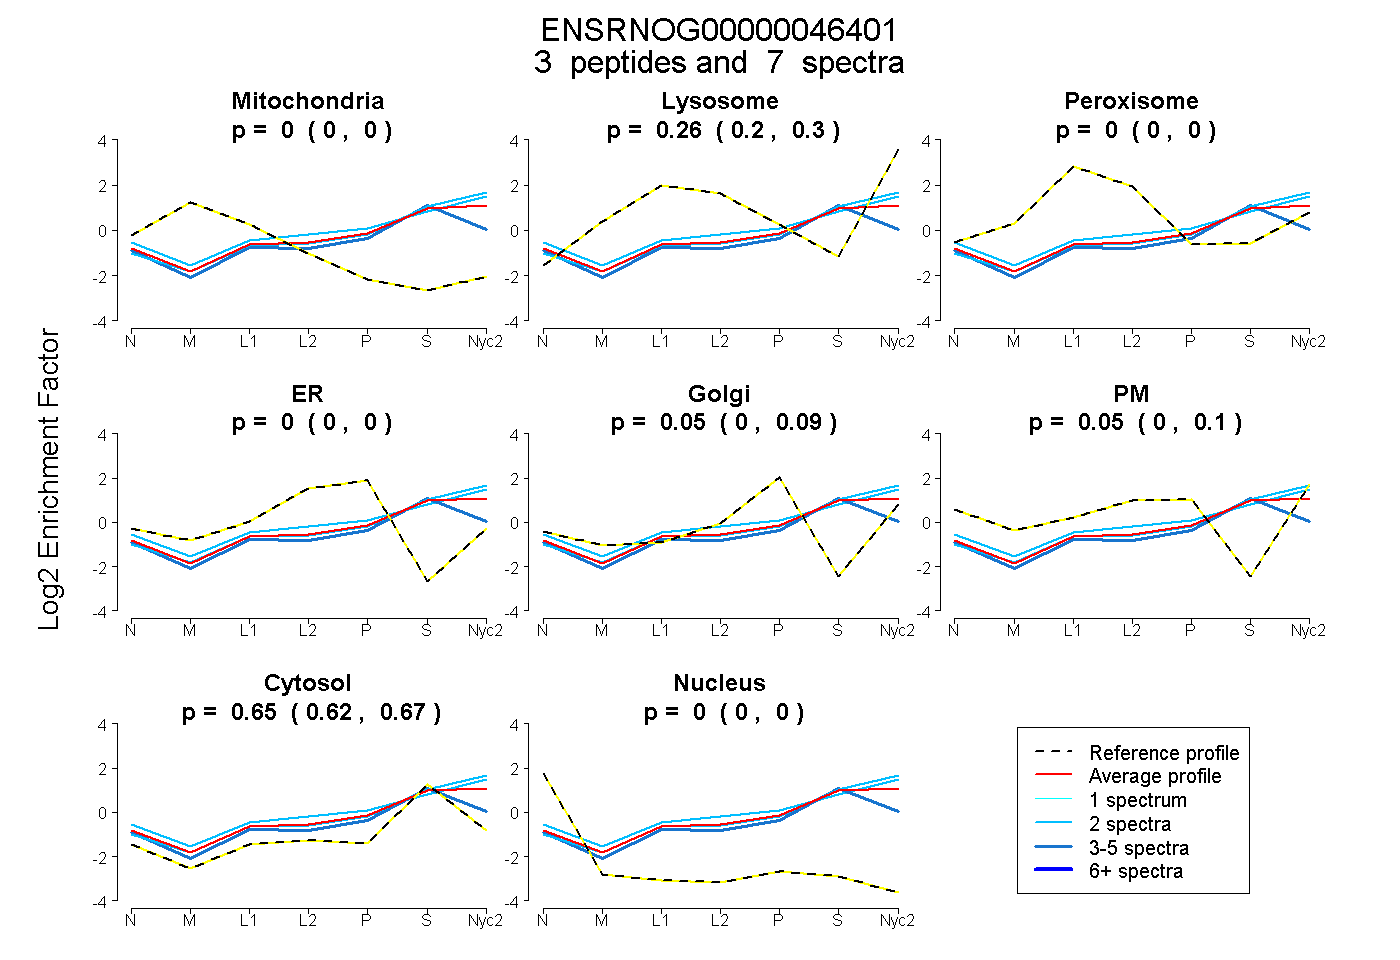
| Plot | Mito | Lyso | Perox | ER | Golgi | PM | Cytosol | Nucleus | |||||
| Expt A |
3 peptides |
7 spectra |
|
0.000 0.000 | 0.000 |
0.256 0.196 | 0.301 |
0.000 0.000 | 0.000 |
0.000 0.000 | 0.000 |
0.053 0.000 | 0.092 |
0.045 0.000 | 0.103 |
0.646 0.620 | 0.669 |
0.000 0.000 | 0.000 |
| 2 spectra, SSNTAYMELSR | 0.000 | 0.341 | 0.000 | 0.000 | 0.034 | 0.000 | 0.624 | 0.000 | ||
| 3 spectra, LTSEDSAVYYCAR | 0.000 | 0.110 | 0.001 | 0.000 | 0.054 | 0.069 | 0.766 | 0.000 | ||
| 2 spectra, ATLTADK | 0.000 | 0.283 | 0.000 | 0.000 | 0.000 | 0.168 | 0.549 | 0.000 |
| Plot | Lyso | Other | |||||||||||
| Expt C |
3 peptides |
15 spectra |
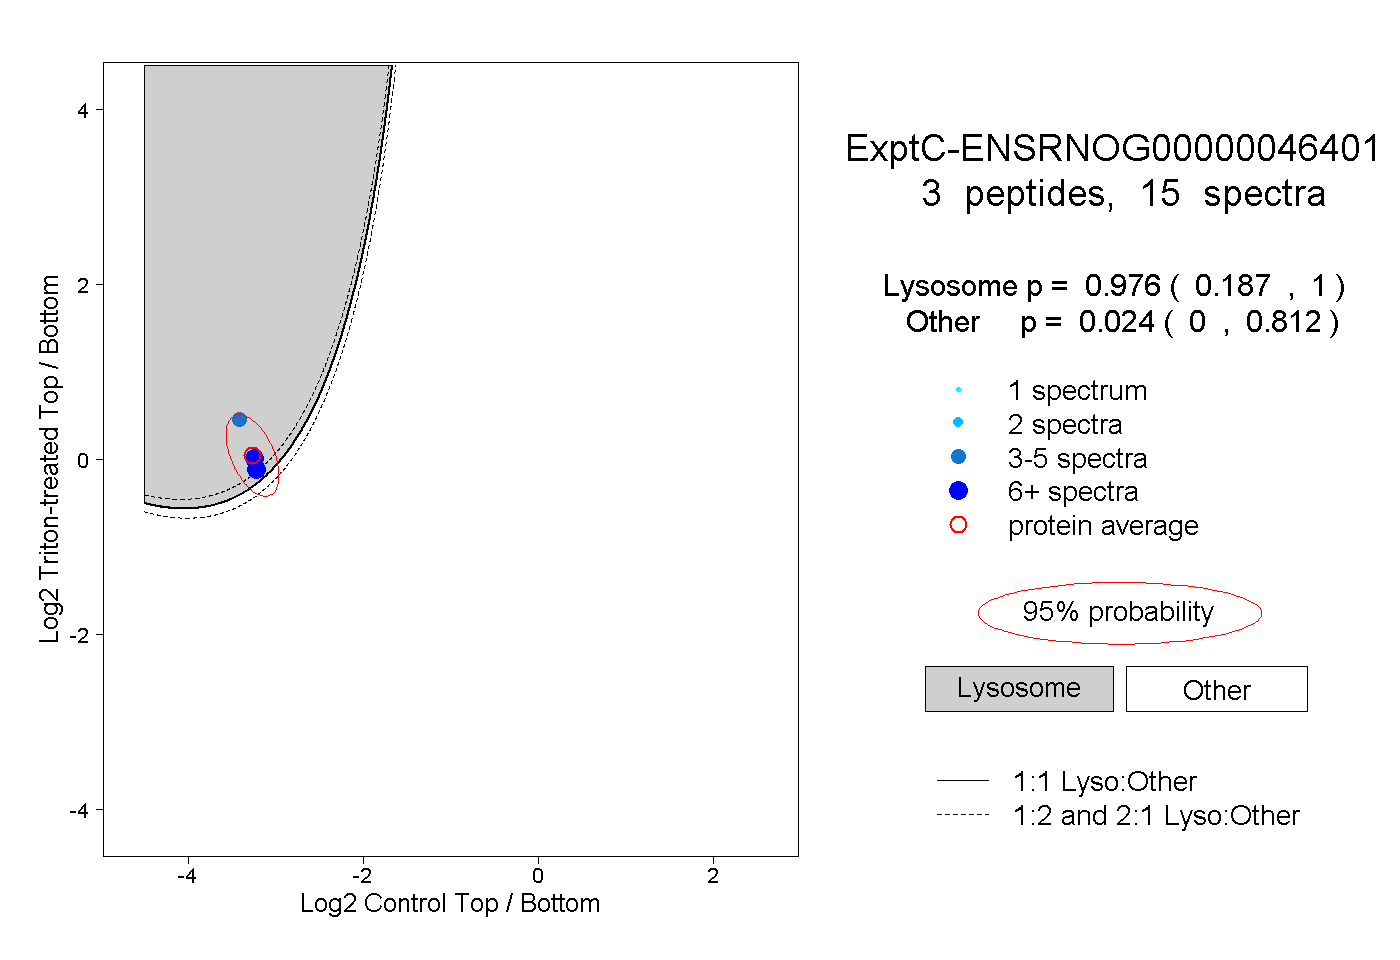 |
0.976 0.187 | 1.000 |
0.024 0.000 | 0.812 |
||||||||
| Plot | Lyso | Other | |||||||||||
| Expt D |
1 peptide |
1 spectrum |
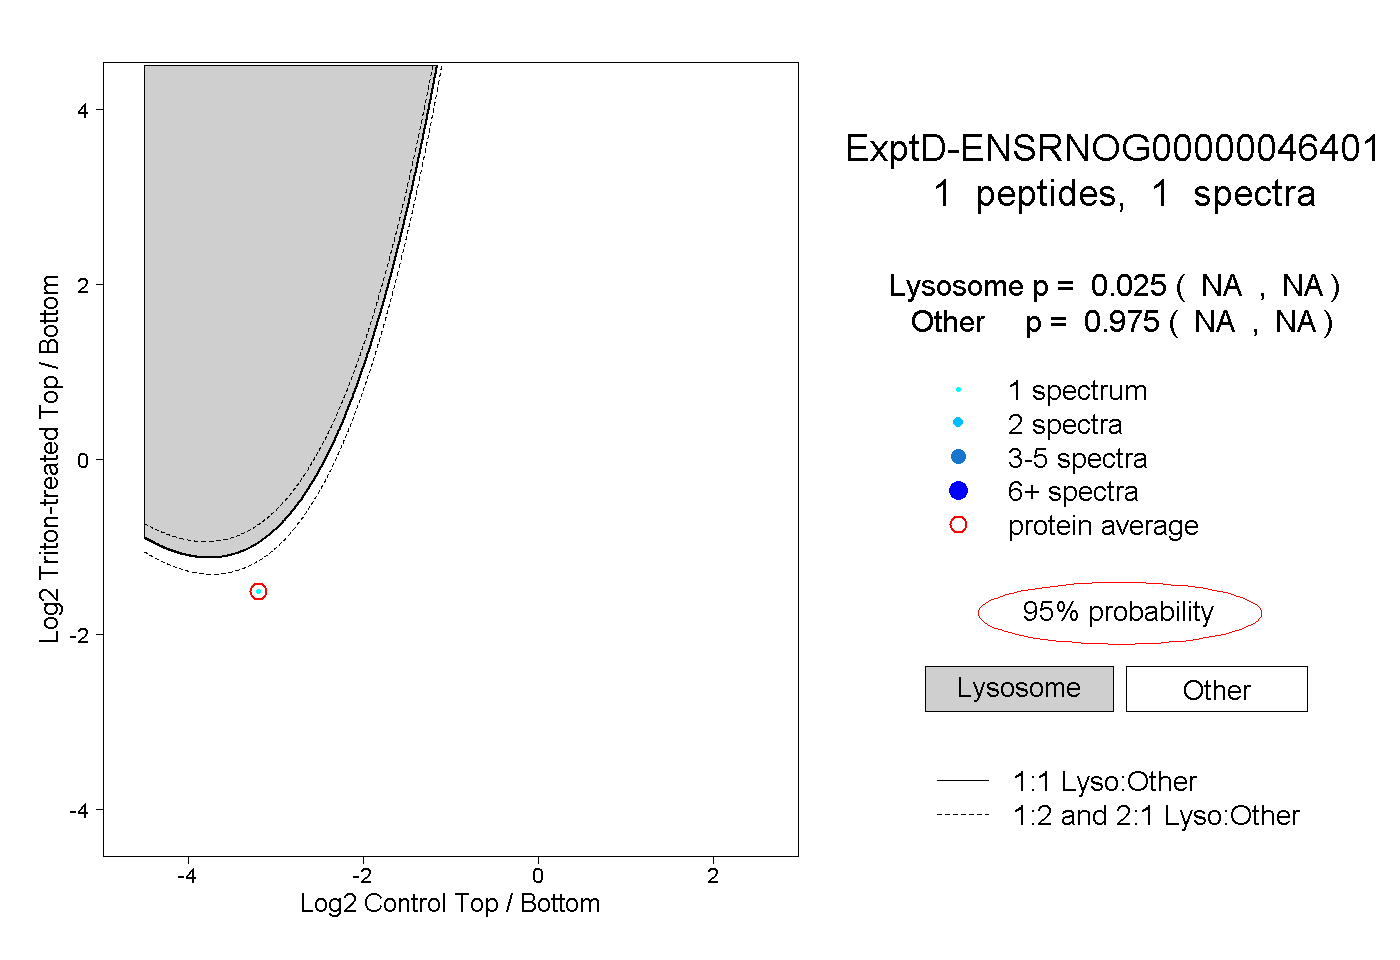 |
0.025 NA | NA |
0.975 NA | NA |