 9
9peptides
spectra
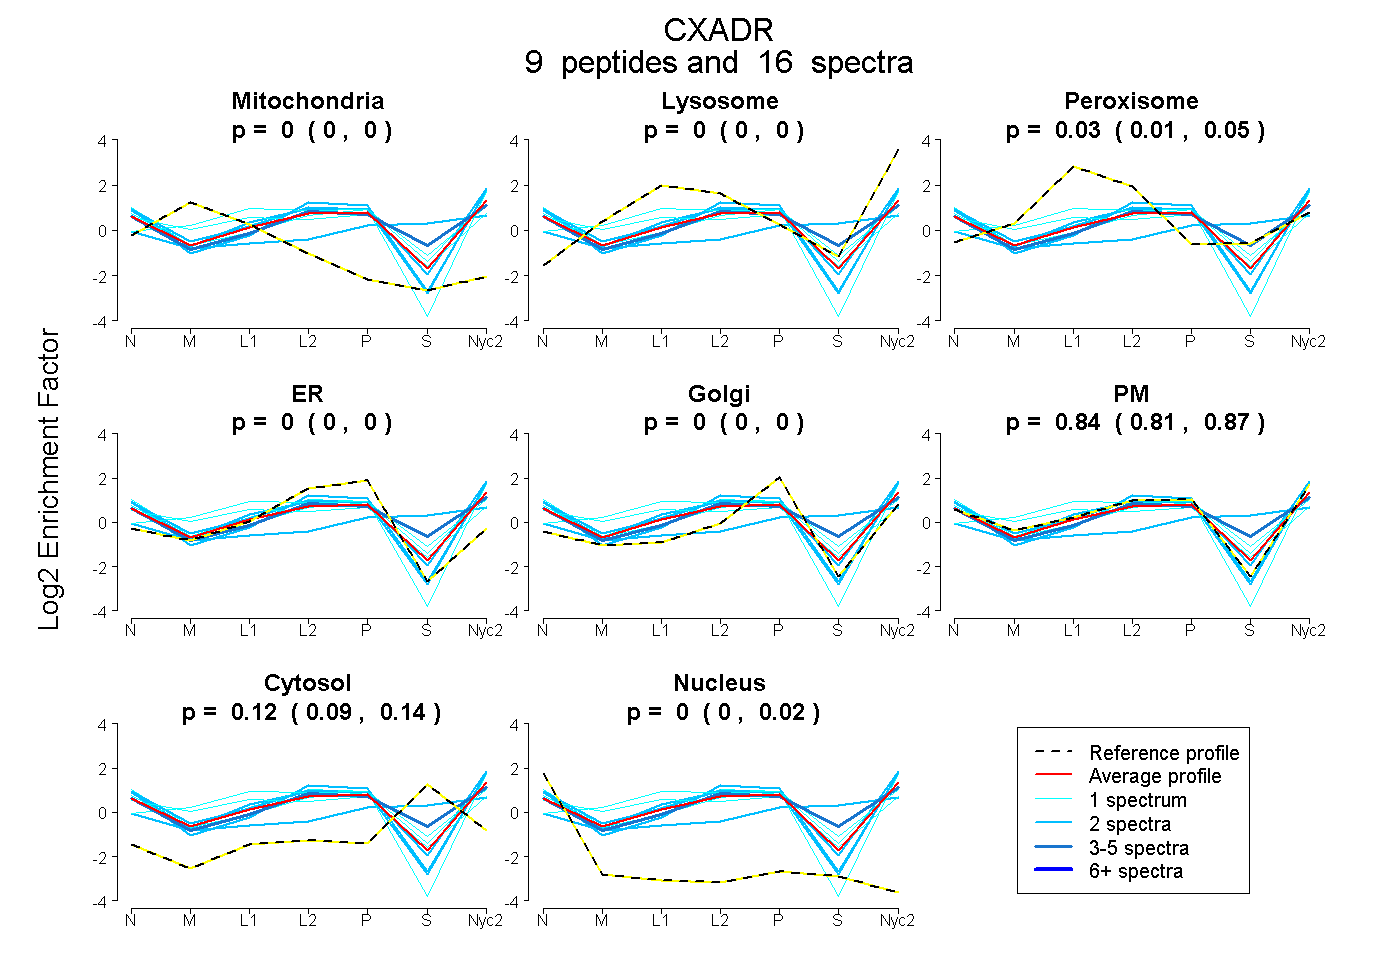
0.000 | 0.000
0.000 | 0.000
0.014 | 0.054
0.000 | 0.000
0.000 | 0.000
0.808 | 0.866
0.087 | 0.138
0.000 | 0.016
1peptide
spectra
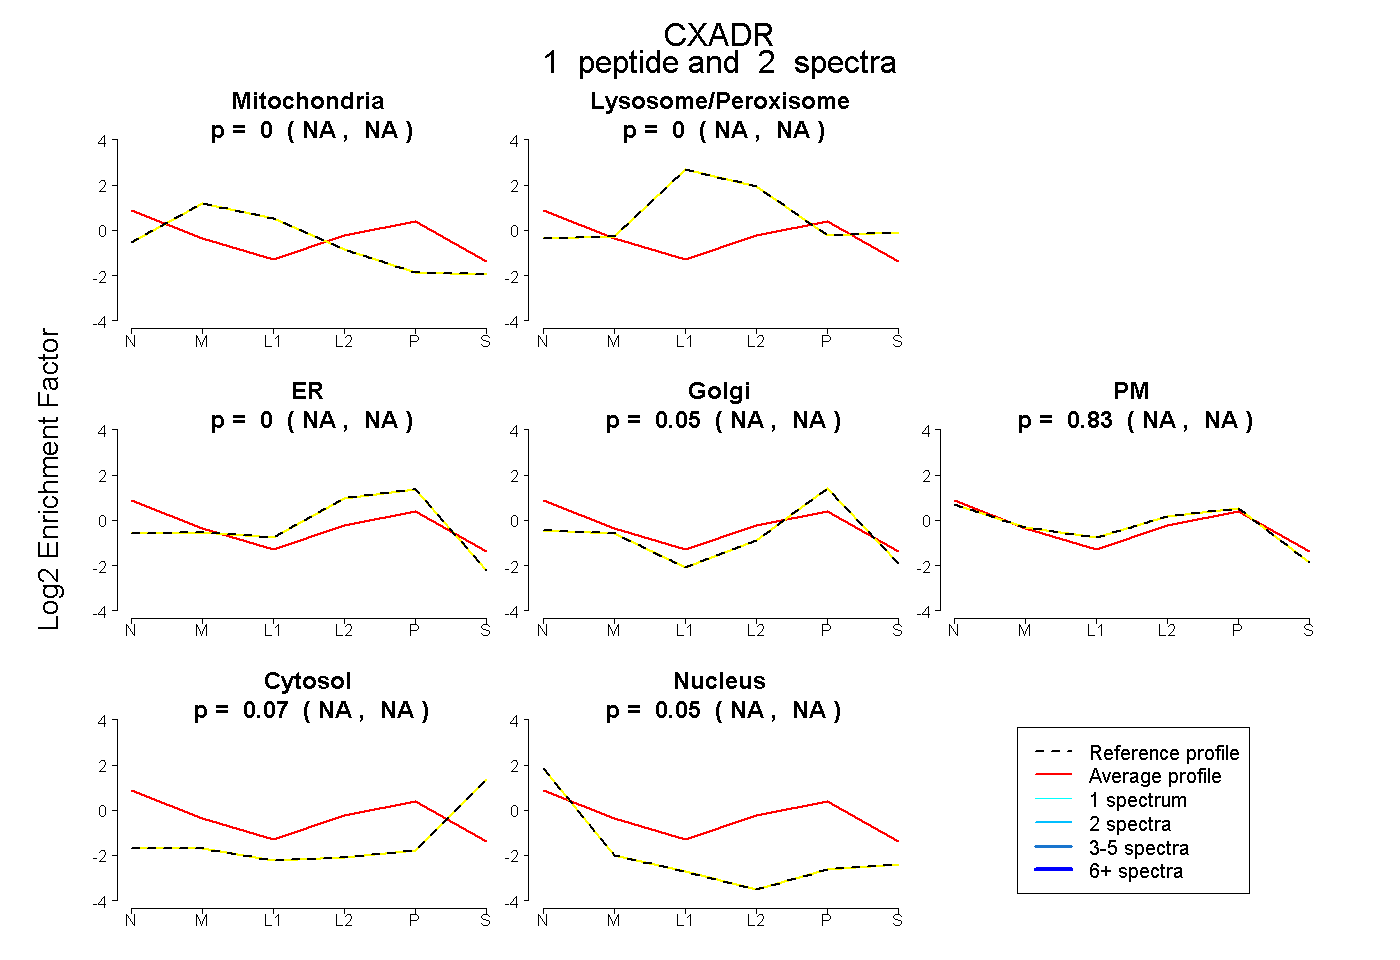
NA | NA
NA | NA
NA | NA
NA | NA
NA | NA
NA | NA
NA | NA
9peptides
spectra
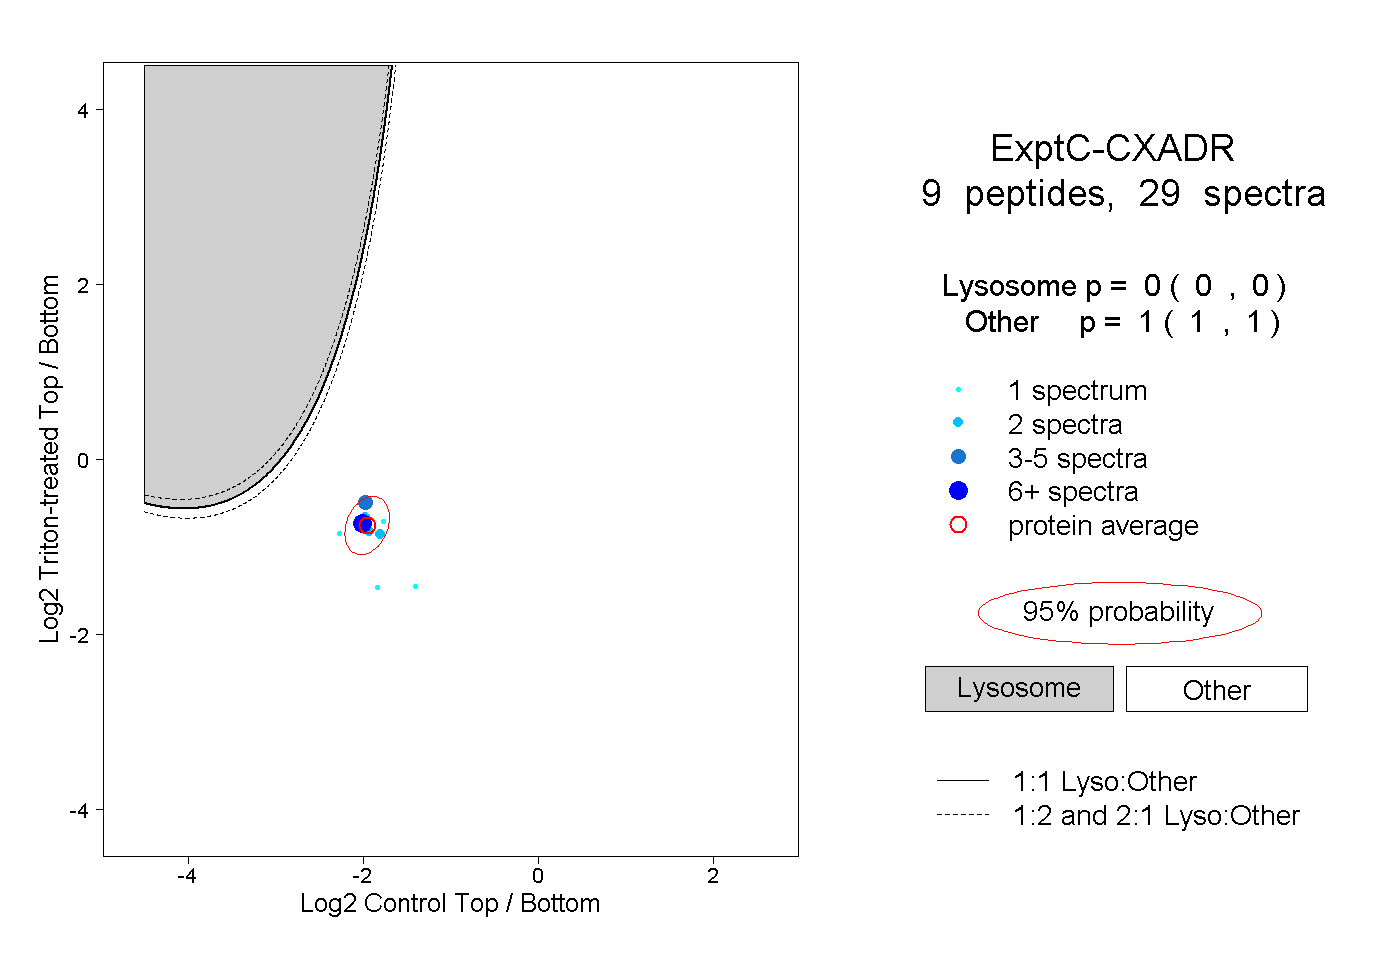
0.000 | 0.000
1.000 | 1.000
3peptides
spectra
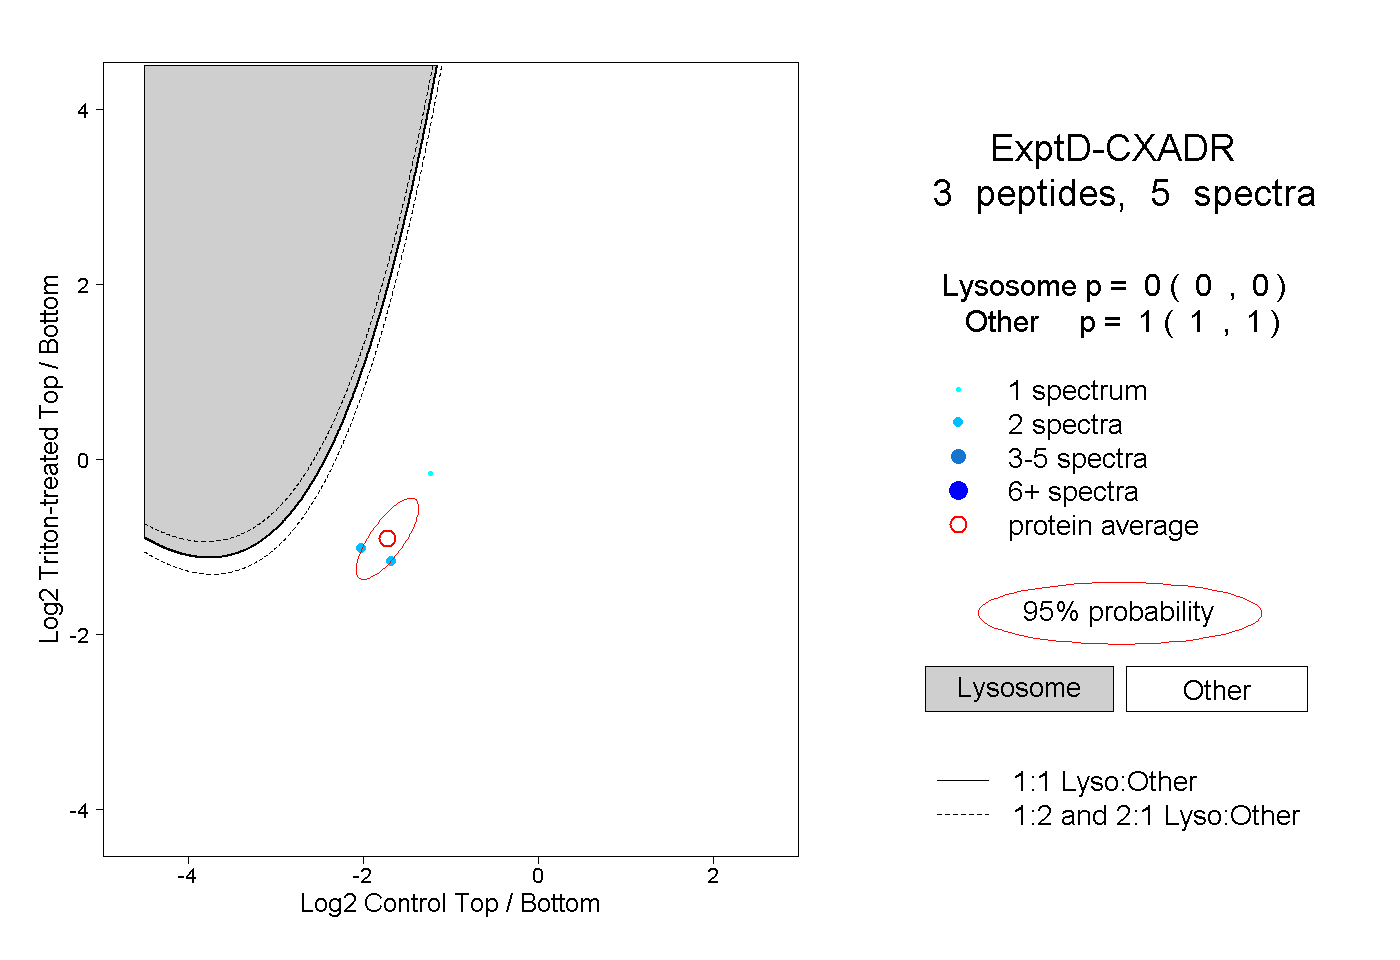
0.000 | 0.000
1.000 | 1.000