 9
9peptides
spectra
0.000 | 0.000
0.000 | 0.000
0.014 | 0.054
0.000 | 0.000
0.000 | 0.000
0.808 | 0.866
0.087 | 0.138
0.000 | 0.016
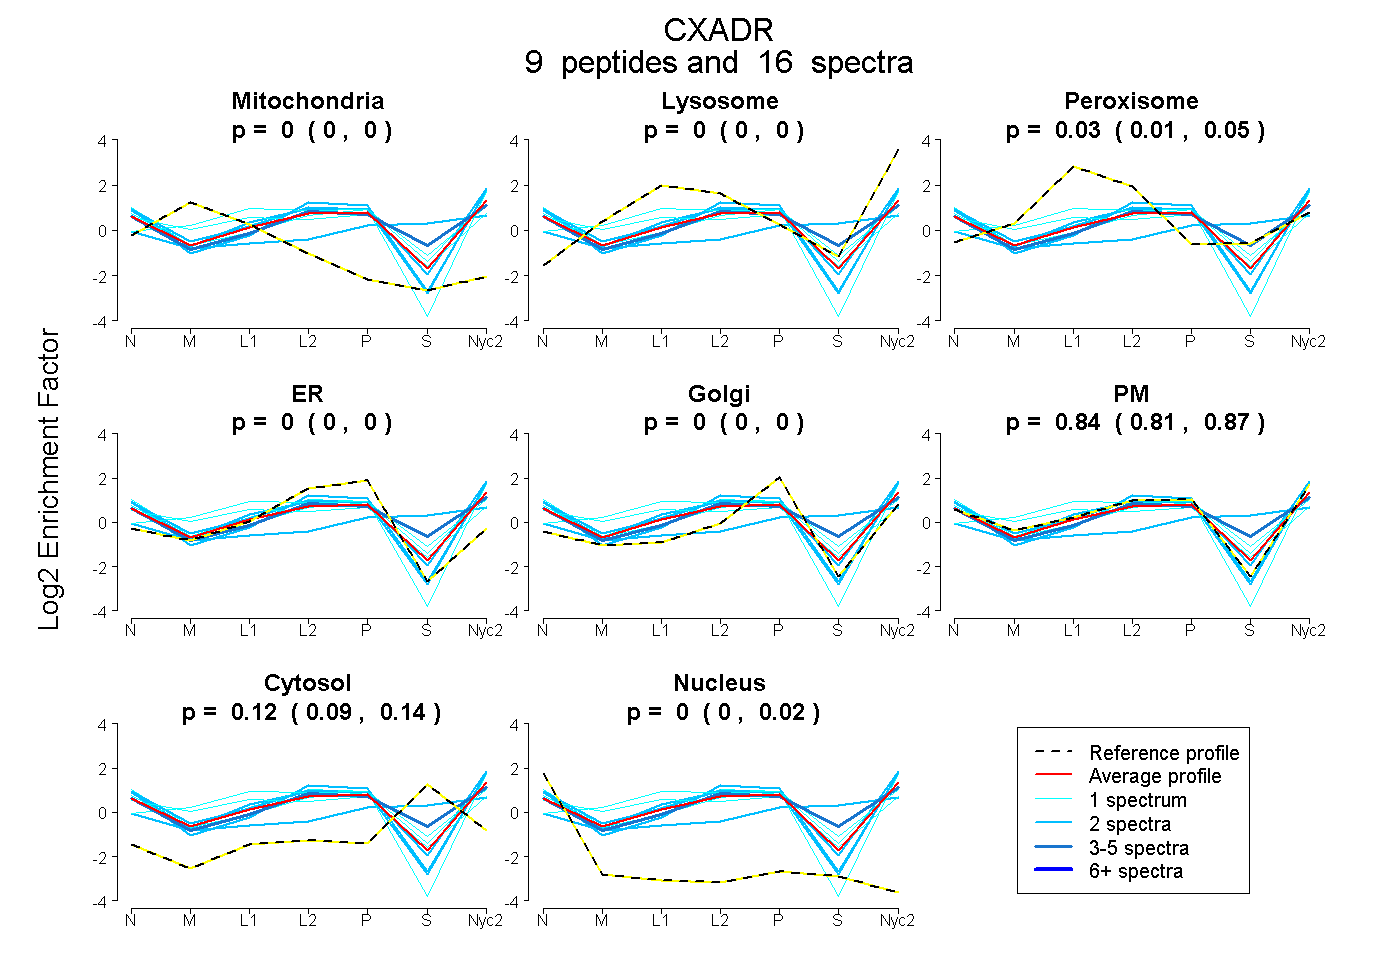
| Plot | Mito | Lyso | Perox | ER | Golgi | PM | Cytosol | Nucleus | |||||
| Expt A |
9 peptides |
16 spectra |
|
0.000 0.000 | 0.000 |
0.000 0.000 | 0.000 |
0.033 0.014 | 0.054 |
0.000 0.000 | 0.000 |
0.000 0.000 | 0.000 |
0.845 0.808 | 0.866 |
0.123 0.087 | 0.138 |
0.000 0.000 | 0.016 |
| 2 spectra, GETAYLPCK | 0.000 | 0.061 | 0.000 | 0.000 | 0.000 | 0.435 | 0.504 | 0.000 | ||
| 1 spectrum, MPTPWLAEMTSPVISVK | 0.101 | 0.000 | 0.207 | 0.000 | 0.119 | 0.532 | 0.024 | 0.018 | ||
| 1 spectrum, EVHHDIR | 0.000 | 0.000 | 0.000 | 0.000 | 0.000 | 0.843 | 0.157 | 0.000 | ||
| 1 spectrum, VDQVIILYSGDK | 0.000 | 0.023 | 0.450 | 0.000 | 0.340 | 0.188 | 0.000 | 0.000 | ||
| 2 spectra, APGVANR | 0.000 | 0.000 | 0.030 | 0.000 | 0.000 | 0.933 | 0.038 | 0.000 | ||
| 4 spectra, VGSDQCMLR | 0.000 | 0.000 | 0.081 | 0.000 | 0.000 | 0.680 | 0.239 | 0.000 | ||
| 2 spectra, CFVDGSGEIGNDFK | 0.000 | 0.000 | 0.000 | 0.000 | 0.005 | 0.965 | 0.000 | 0.030 | ||
| 1 spectrum, IYDNYYPDLK | 0.000 | 0.000 | 0.000 | 0.000 | 0.000 | 0.978 | 0.000 | 0.022 | ||
| 2 spectra, LDVVPPSNR | 0.000 | 0.000 | 0.000 | 0.000 | 0.000 | 0.987 | 0.000 | 0.013 |
| Plot | Mito | Lyso or Perox | ER | Golgi | PM | Cytosol | Nucleus | ||||||
| Expt B |
1 peptide |
2 spectra |
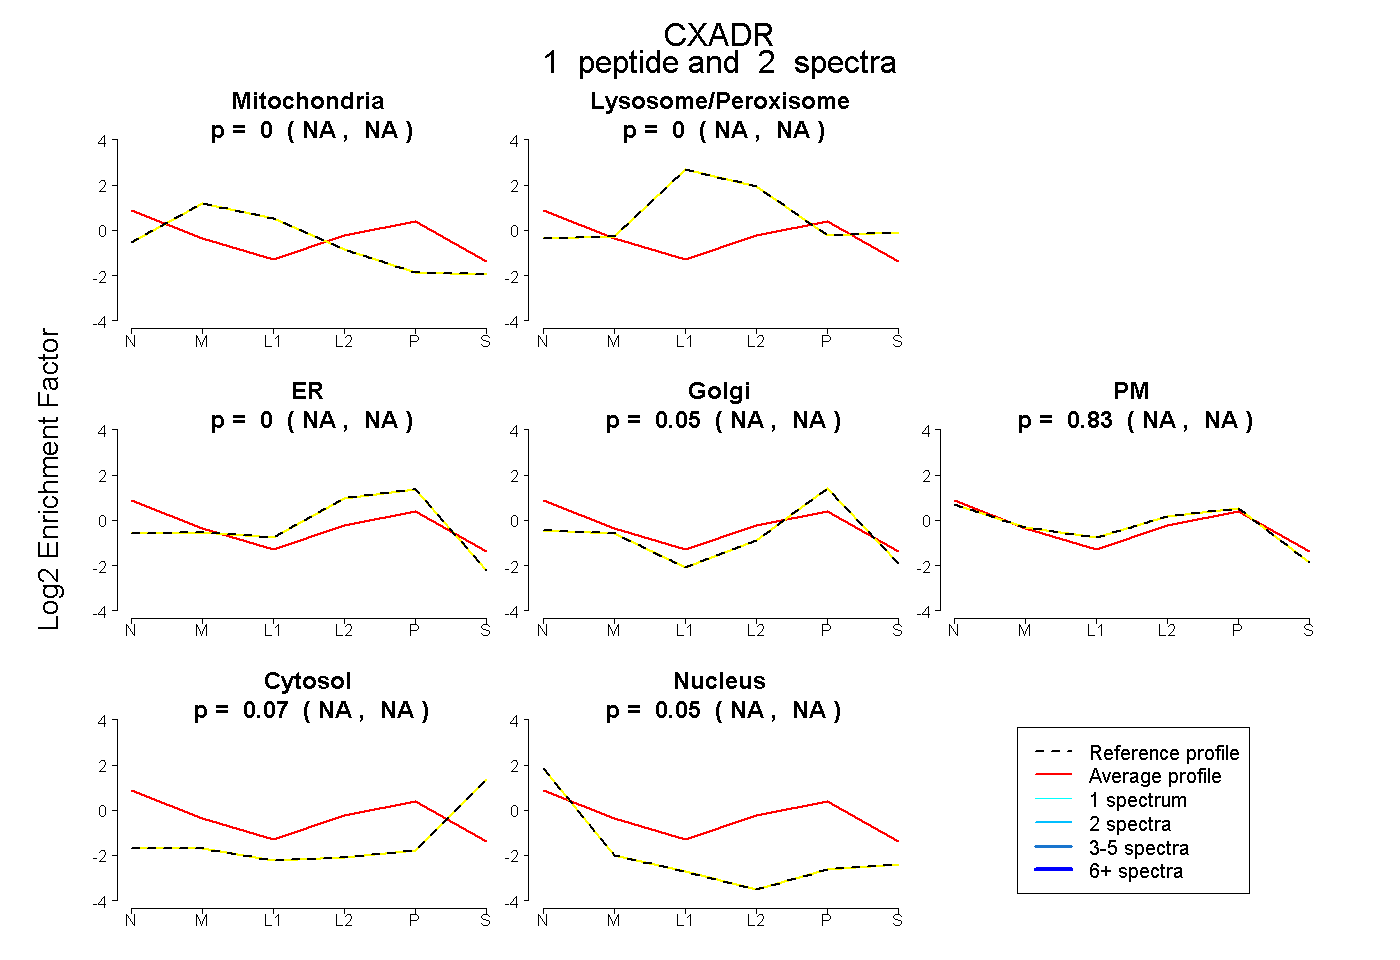 |
0.000 NA | NA |
0.000 NA | NA |
0.000 NA | NA |
0.048 NA | NA |
0.832 NA | NA |
0.071 NA | NA |
0.049 NA | NA |
|||
| Plot | Lyso | Other | |||||||||||
| Expt C |
9 peptides |
29 spectra |
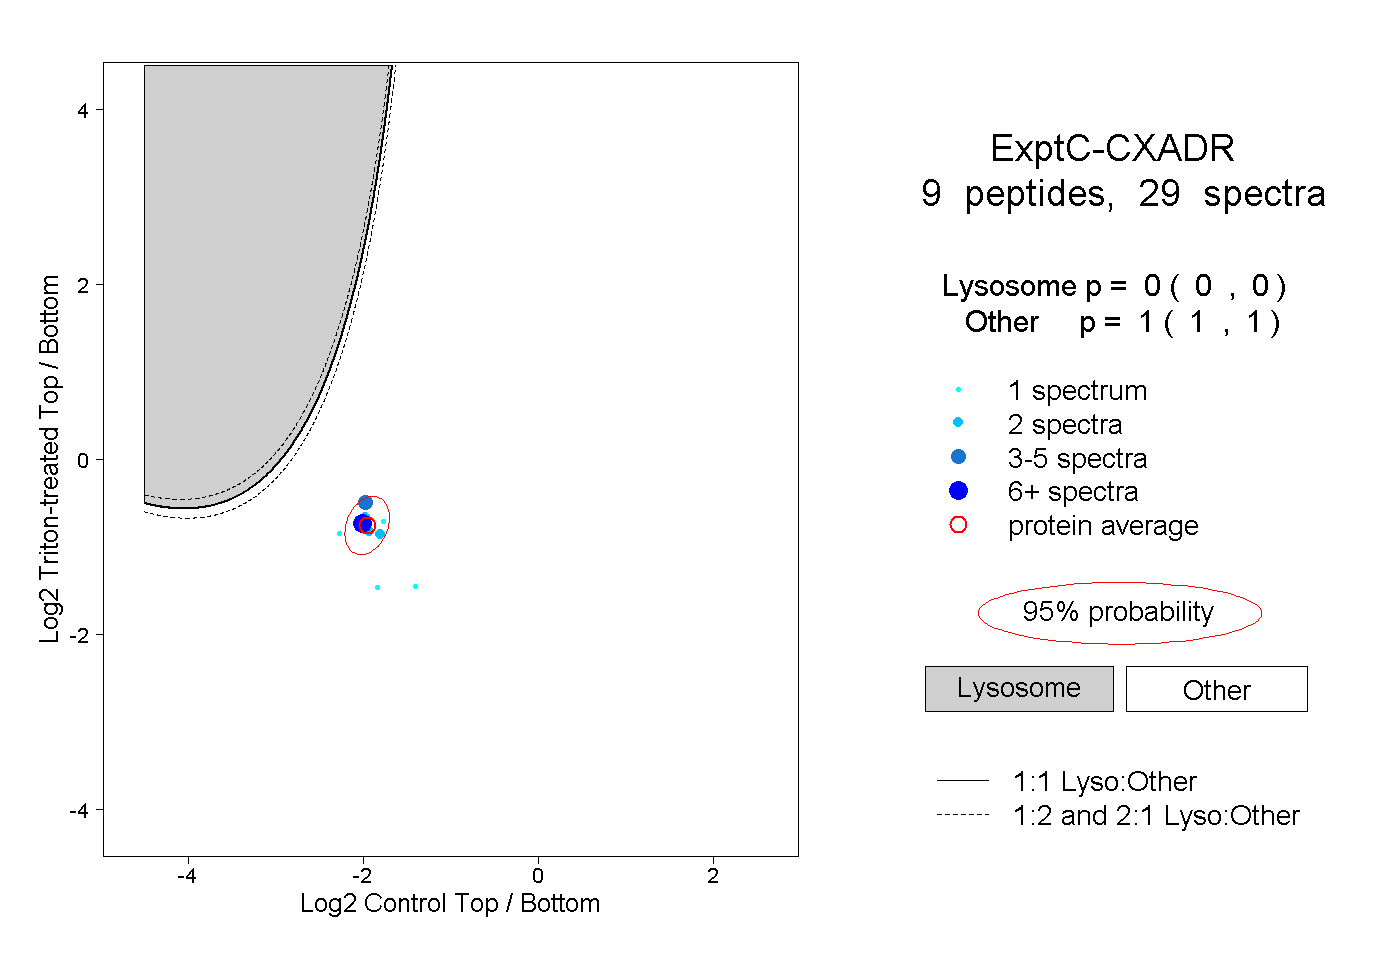 |
0.000 0.000 | 0.000 |
1.000 1.000 | 1.000 |
||||||||
| Plot | Lyso | Other | |||||||||||
| Expt D |
3 peptides |
5 spectra |
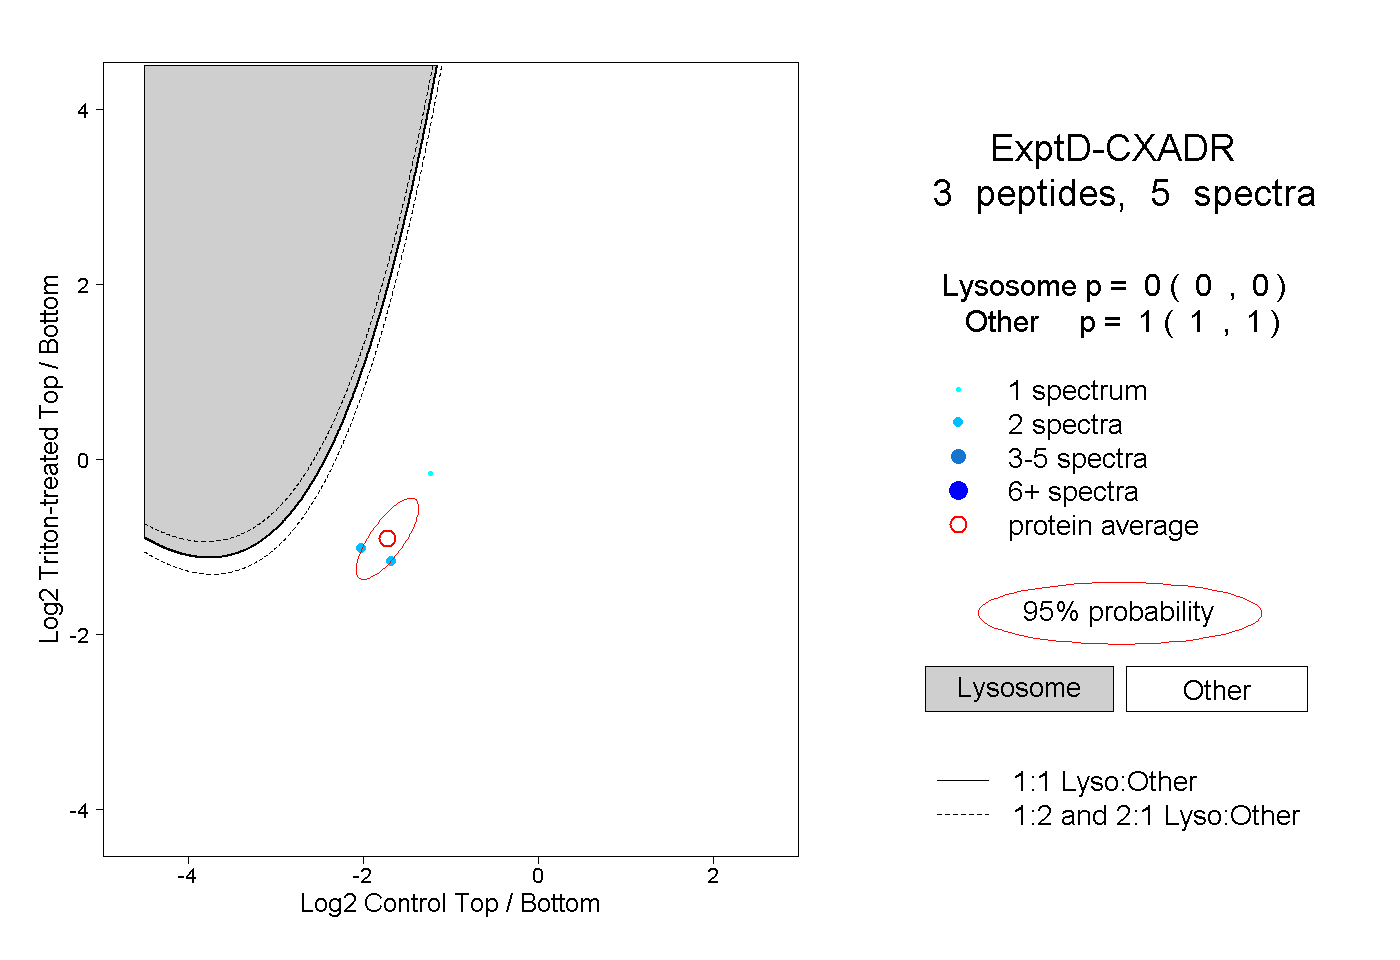 |
0.000 0.000 | 0.000 |
1.000 1.000 | 1.000 |