 7
7peptides
spectra
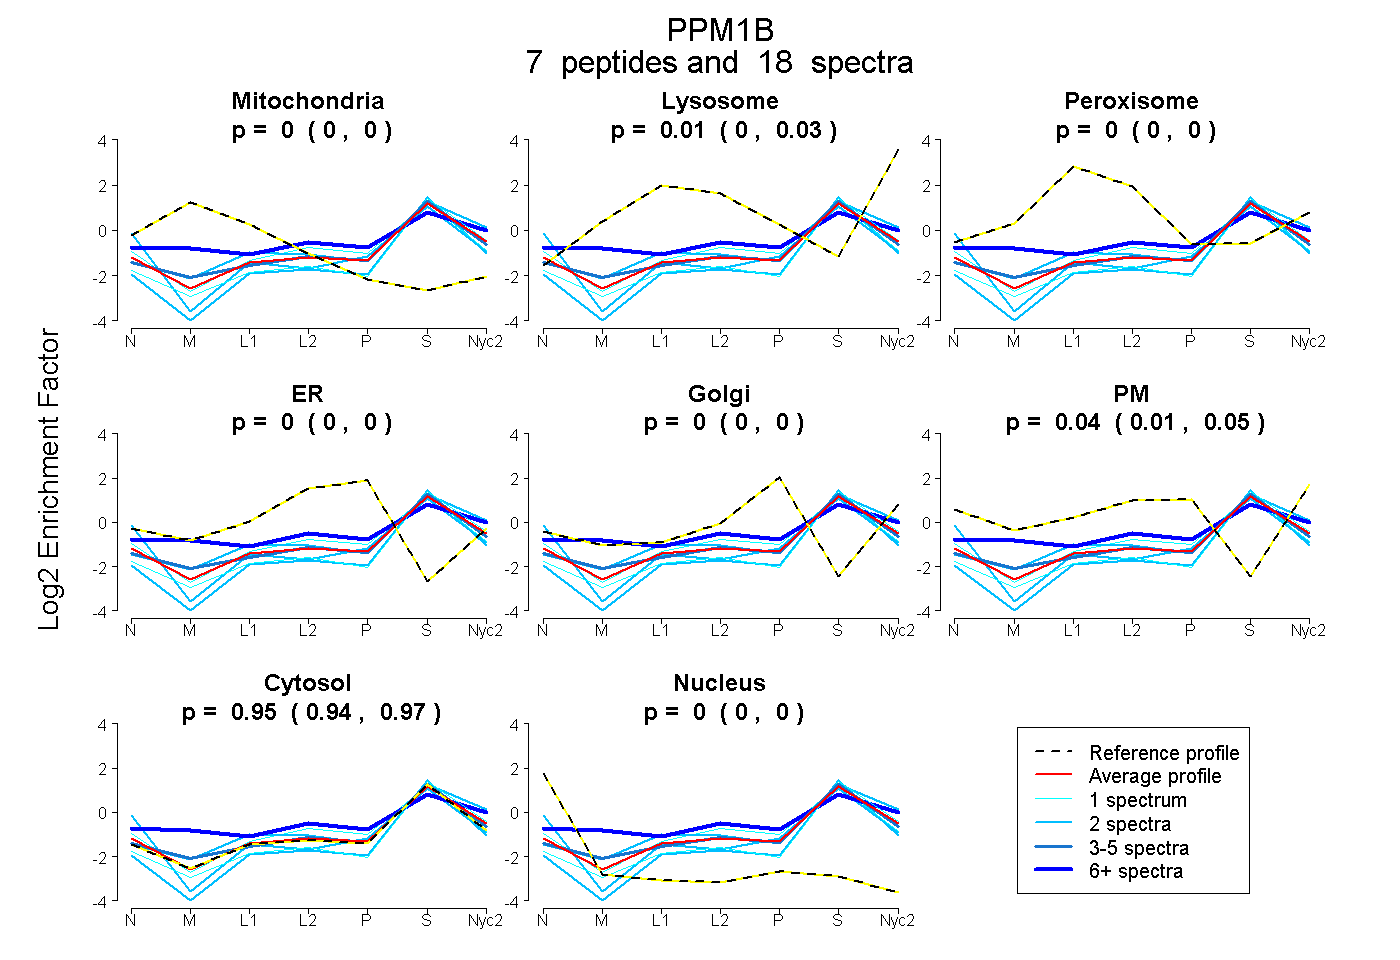
0.000 | 0.000
0.000 | 0.027
0.000 | 0.000
0.000 | 0.000
0.000 | 0.000
0.011 | 0.052
0.940 | 0.967
0.000 | 0.003
2peptides
spectra
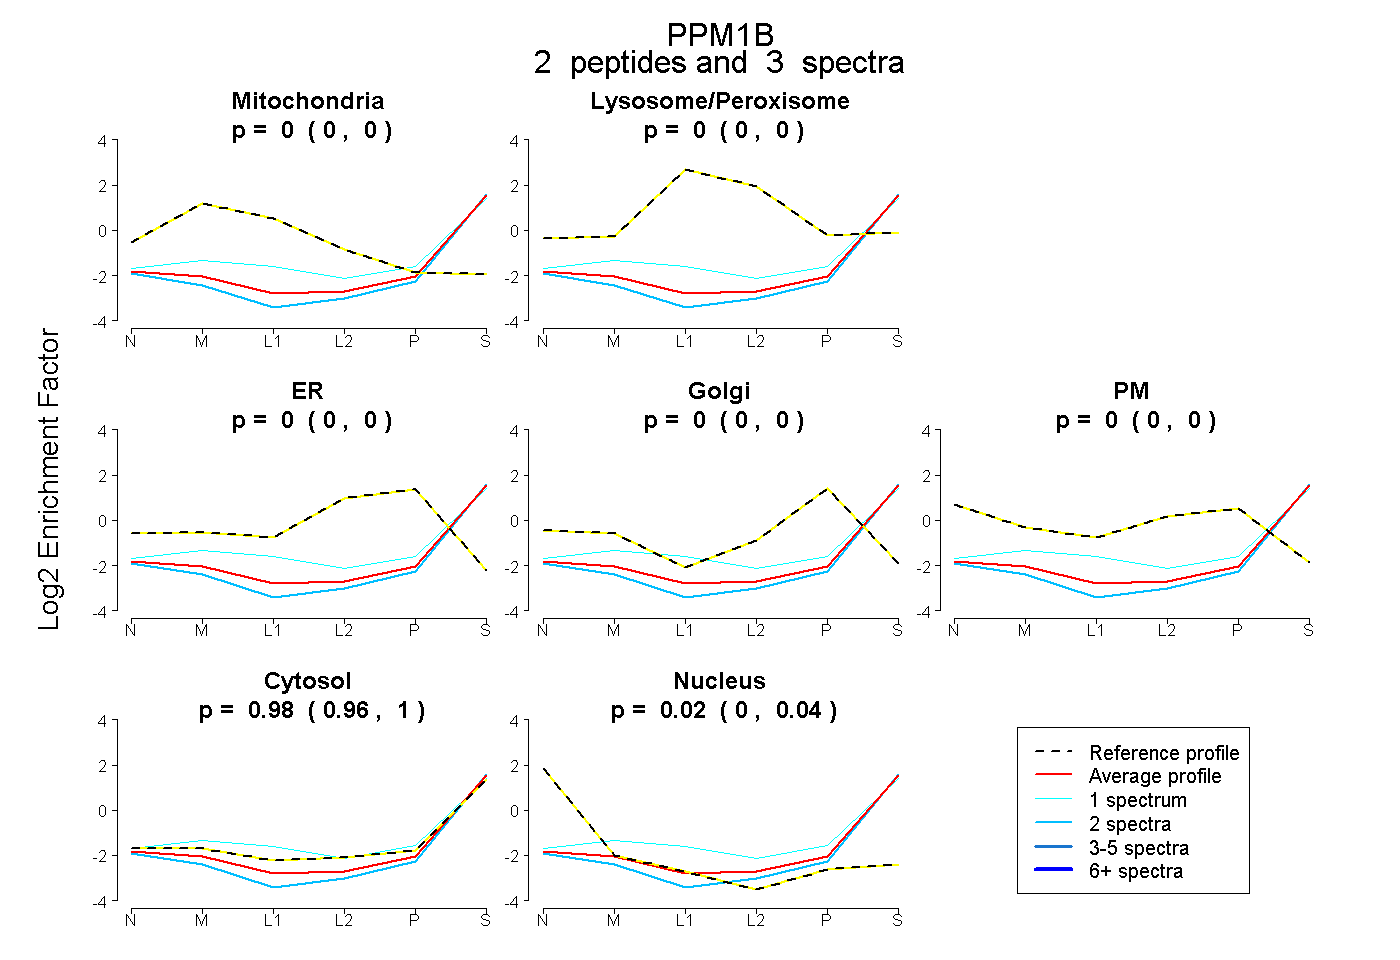
0.000 | 0.000
0.000 | 0.000
0.000 | 0.000
0.000 | 0.000
0.000 | 0.000
0.958 | 1.000
0.000 | 0.037
5peptides
spectra
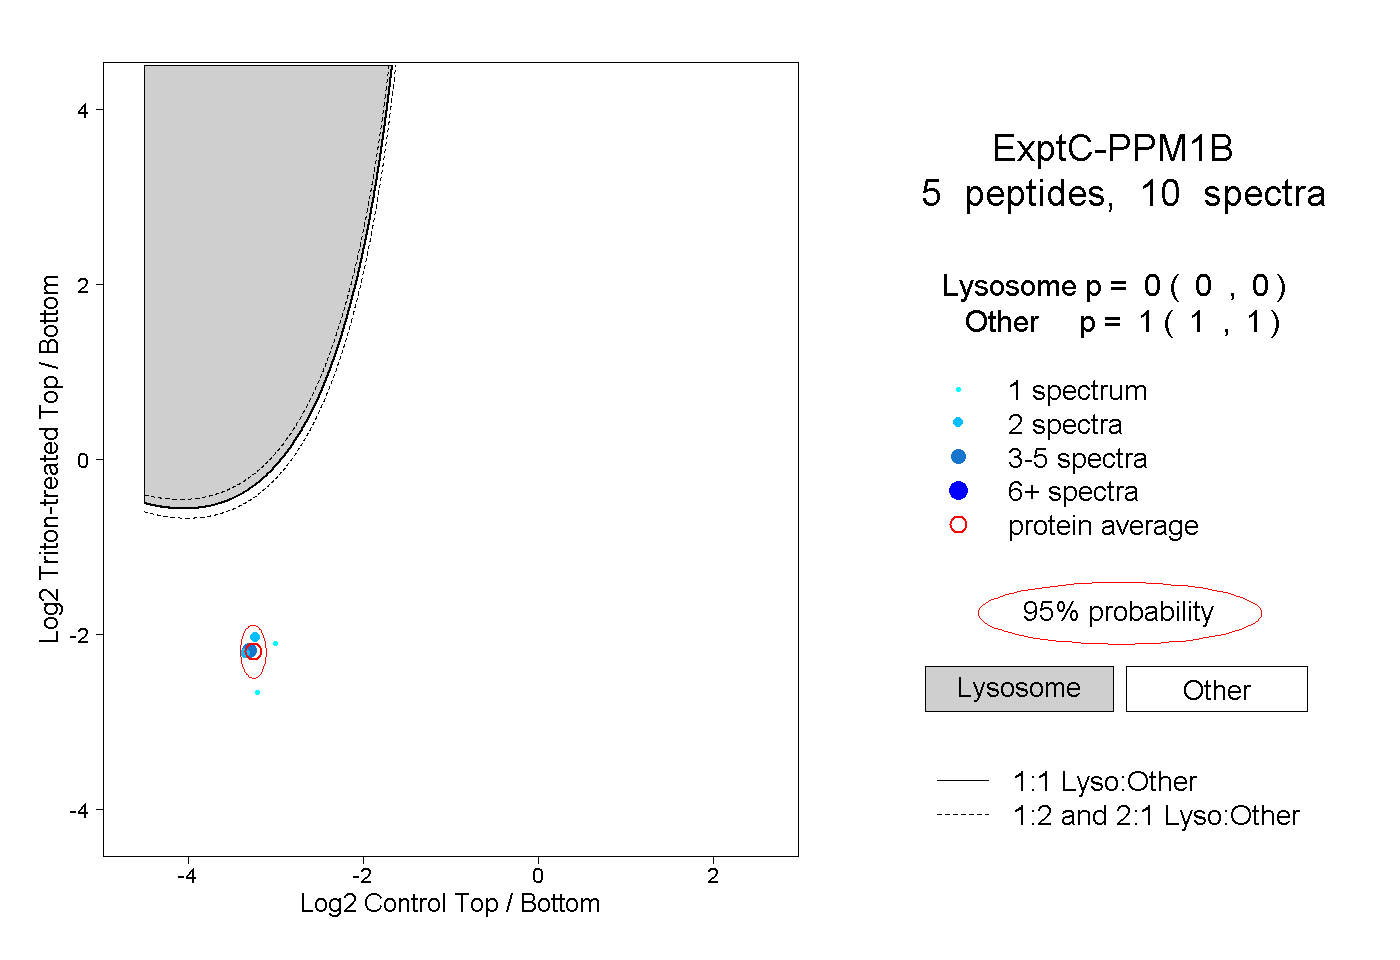
0.000 | 0.000
1.000 | 1.000