 7
7peptides
spectra
0.000 | 0.000
0.000 | 0.027
0.000 | 0.000
0.000 | 0.000
0.000 | 0.000
0.011 | 0.052
0.940 | 0.967
0.000 | 0.003
| Plot | Mito | Lyso | Perox | ER | Golgi | PM | Cytosol | Nucleus | |||||
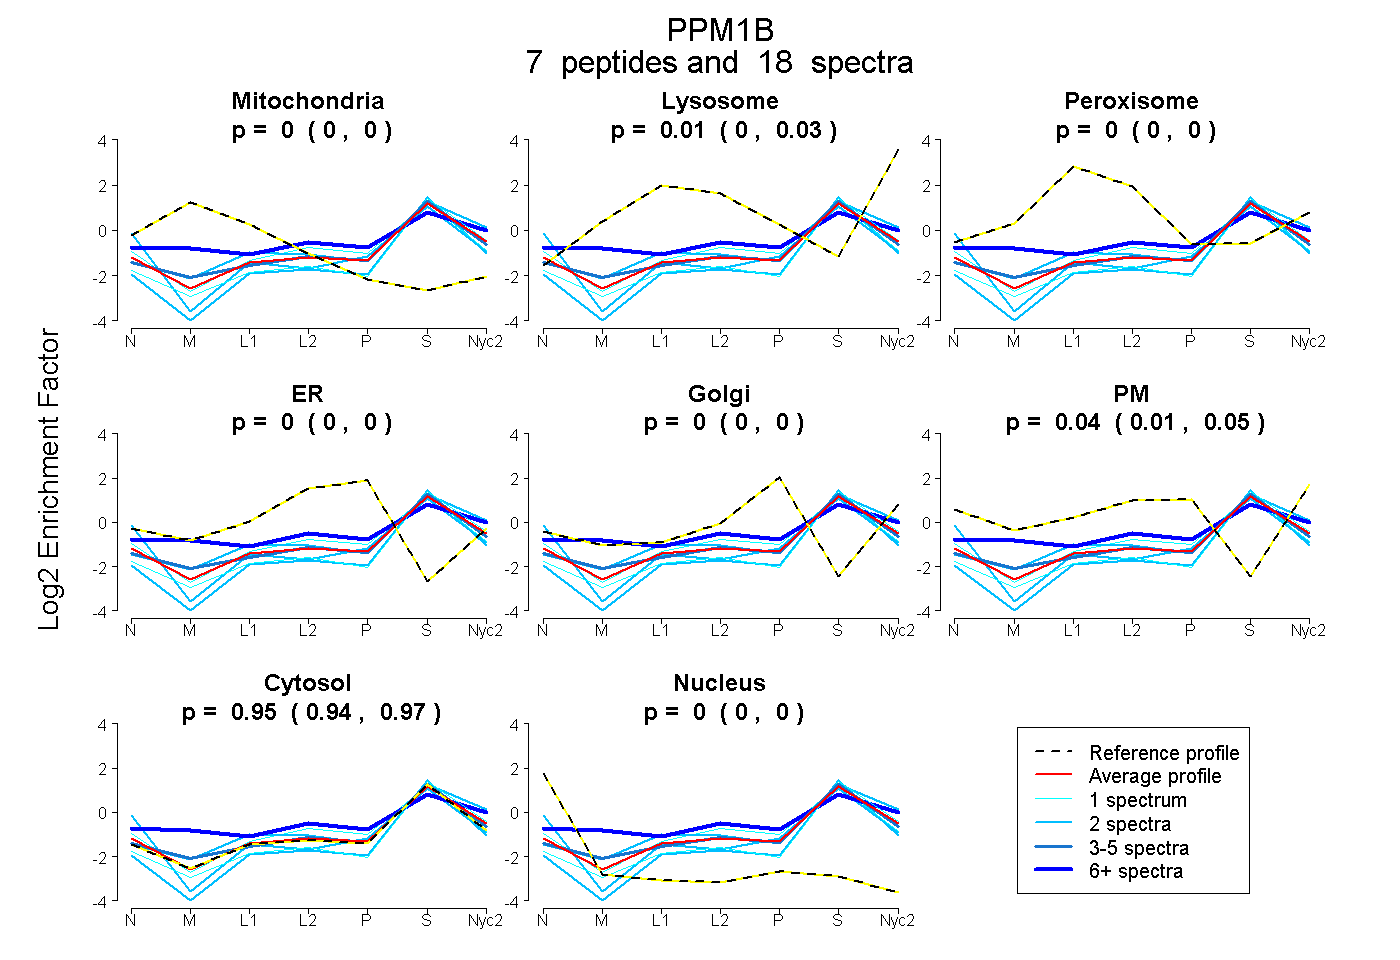
| Expt A |
7 peptides |
18 spectra |
|
0.000 0.000 | 0.000 |
0.007 0.000 | 0.027 |
0.000 0.000 | 0.000 |
0.000 0.000 | 0.000 |
0.000 0.000 | 0.000 |
0.038 0.011 | 0.052 |
0.955 0.940 | 0.967 |
0.000 0.000 | 0.003 |
| 2 spectra, NFSDLR | 0.000 | 0.132 | 0.000 | 0.000 | 0.000 | 0.000 | 0.868 | 0.000 | ||
| 2 spectra, DLELDK | 0.000 | 0.000 | 0.000 | 0.000 | 0.000 | 0.000 | 0.984 | 0.016 | ||
| 1 spectrum, HNAHGAGNGLR | 0.000 | 0.000 | 0.000 | 0.080 | 0.000 | 0.000 | 0.920 | 0.000 | ||
| 6 spectra, SGEEGMPDLAHVMR | 0.078 | 0.126 | 0.001 | 0.000 | 0.000 | 0.130 | 0.665 | 0.000 | ||
| 1 spectrum, SGFALEPSVENVK | 0.000 | 0.000 | 0.000 | 0.000 | 0.000 | 0.000 | 1.000 | 0.000 | ||
| 4 spectra, VEEIMQK | 0.016 | 0.035 | 0.000 | 0.000 | 0.000 | 0.000 | 0.950 | 0.000 | ||
| 2 spectra, ALGDYDYK | 0.000 | 0.000 | 0.000 | 0.000 | 0.000 | 0.000 | 0.866 | 0.134 |
| Plot | Mito | Lyso or Perox | ER | Golgi | PM | Cytosol | Nucleus | ||||||
| Expt B |
2 peptides |
3 spectra |
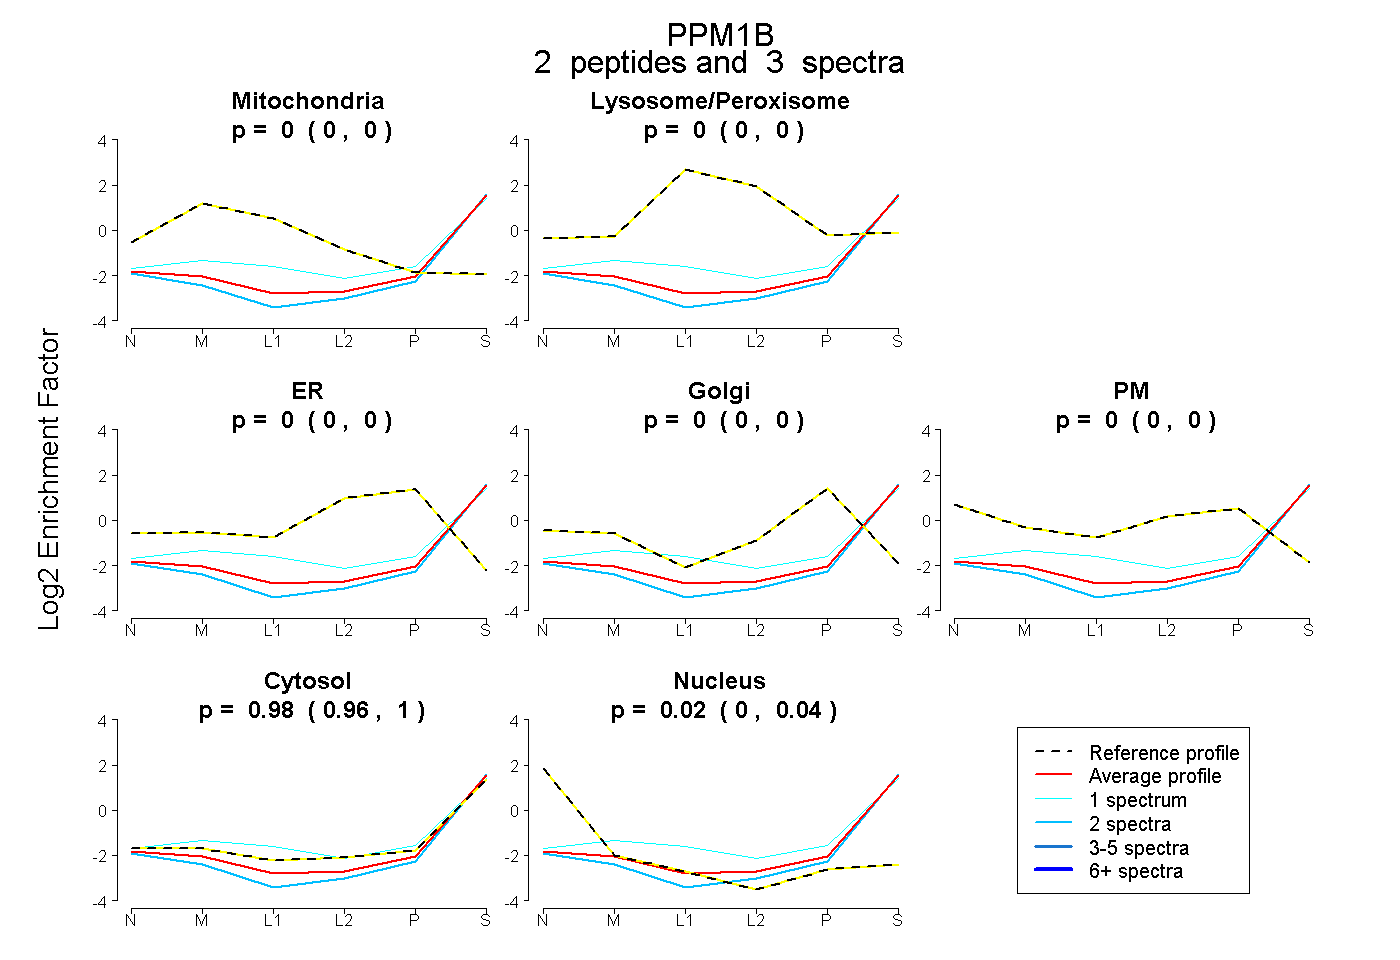 |
0.000 0.000 | 0.000 |
0.000 0.000 | 0.000 |
0.000 0.000 | 0.000 |
0.000 0.000 | 0.000 |
0.000 0.000 | 0.000 |
0.984 0.958 | 1.000 |
0.016 0.000 | 0.037 |
|||
| Plot | Lyso | Other | |||||||||||
| Expt C |
5 peptides |
10 spectra |
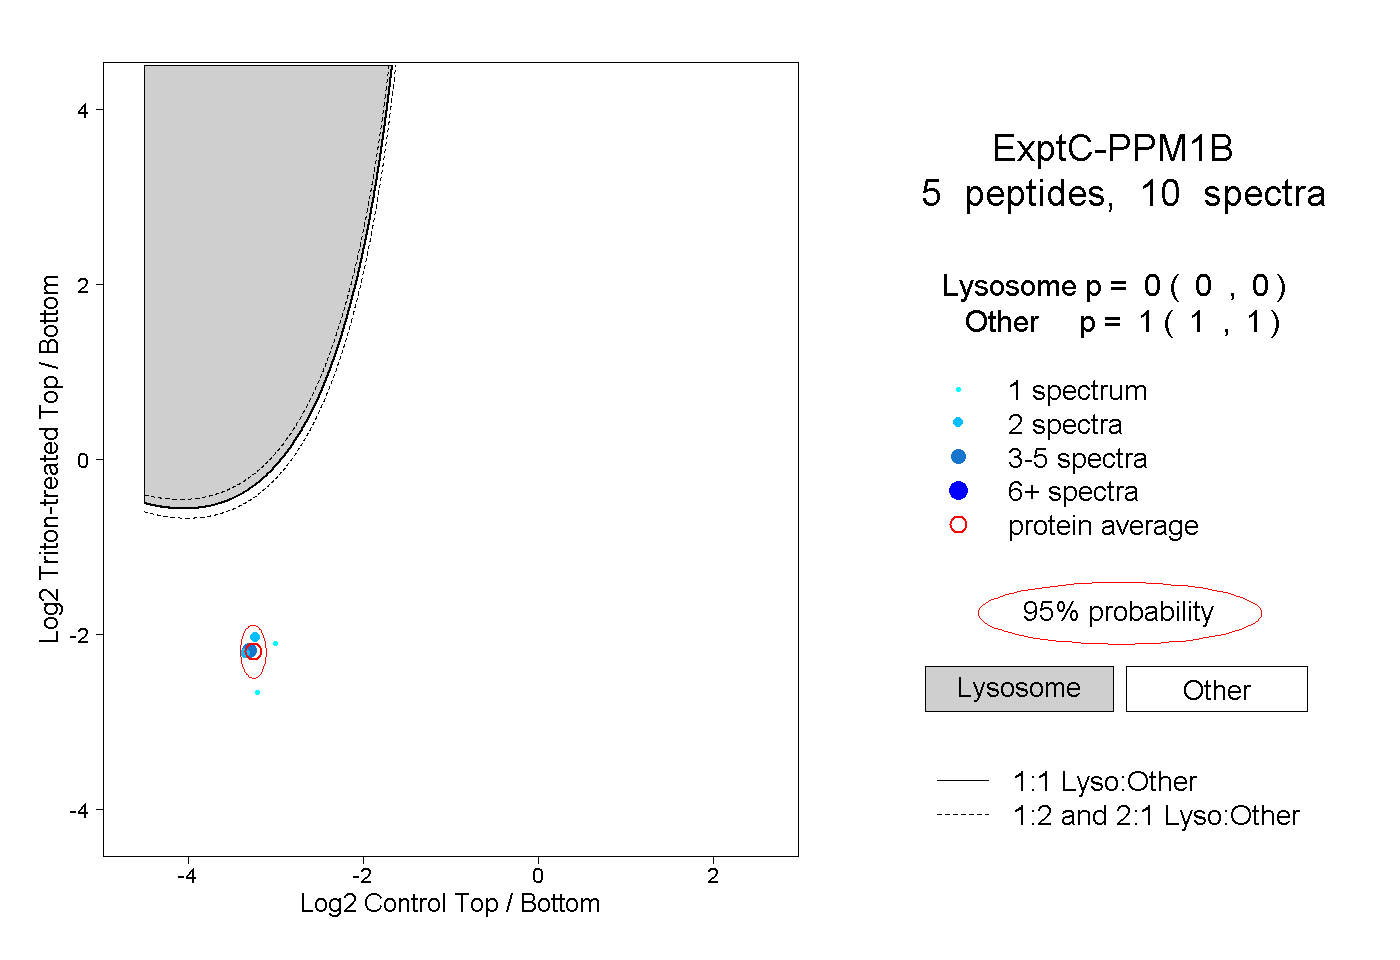 |
0.000 0.000 | 0.000 |
1.000 1.000 | 1.000 |