 4
4peptides
spectra
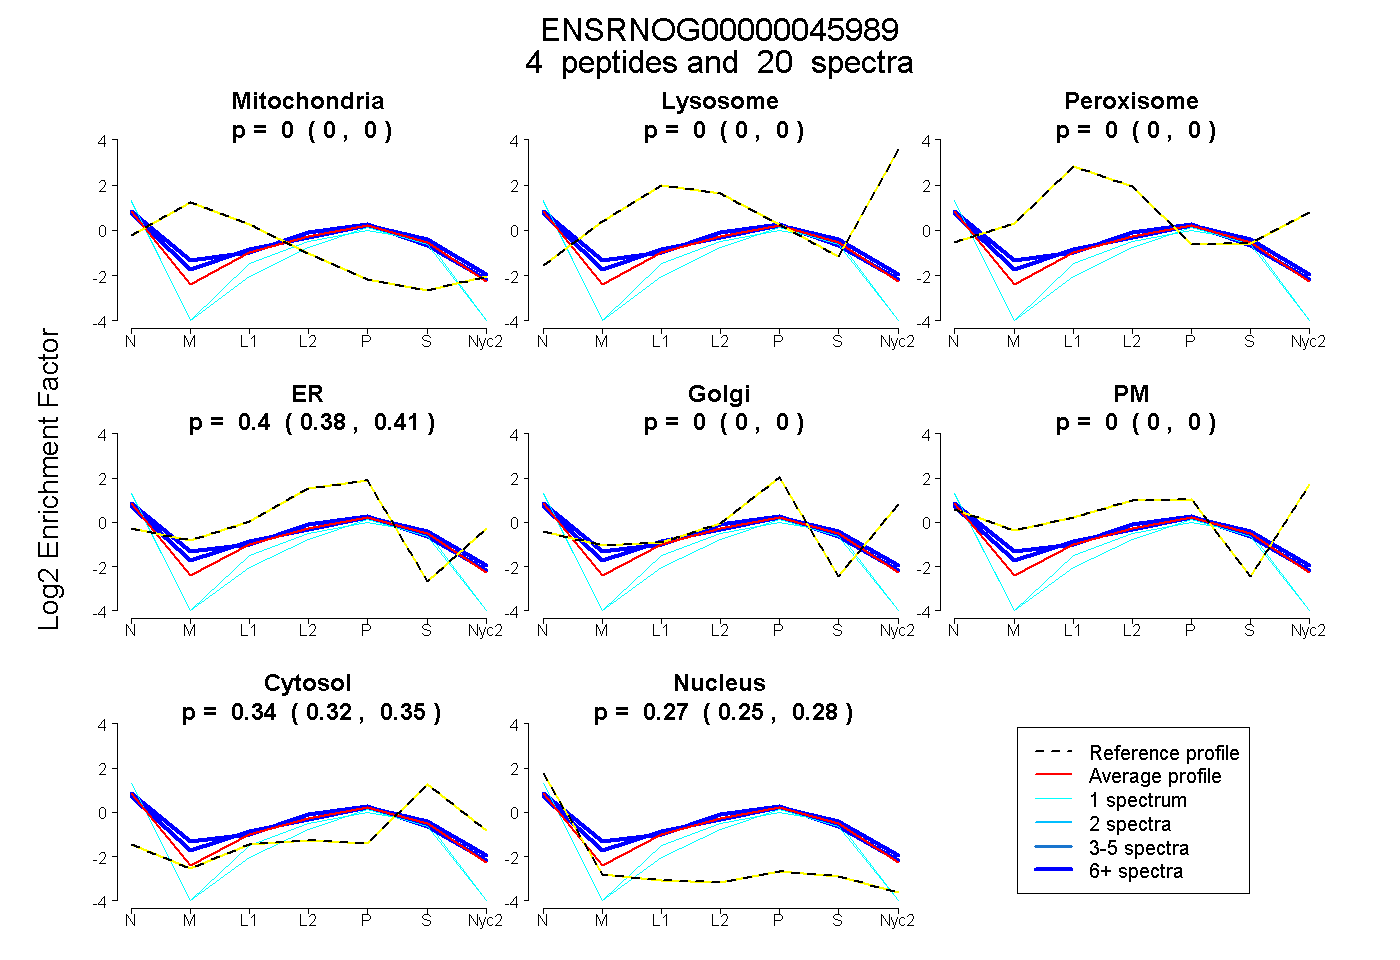
0.000 | 0.000
0.000 | 0.000
0.000 | 0.000
0.383 | 0.410
0.000 | 0.000
0.000 | 0.000
0.320 | 0.348
0.254 | 0.279
2peptides
spectra
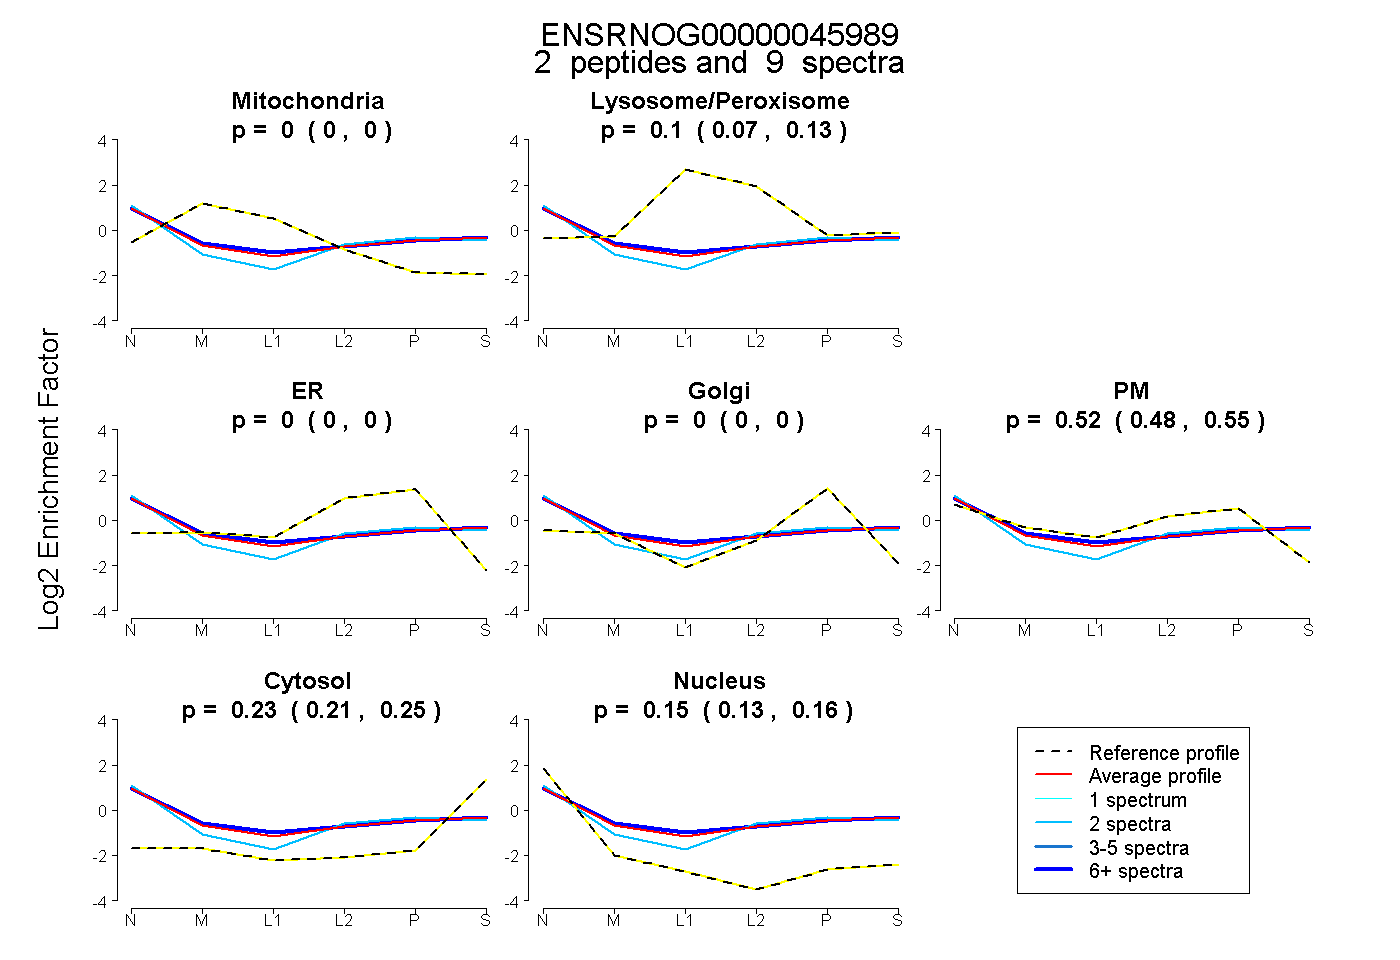
0.000 | 0.000
0.069 | 0.131
0.000 | 0.000
0.000 | 0.000
0.482 | 0.549
0.209 | 0.248
0.131 | 0.165
3peptides
spectra
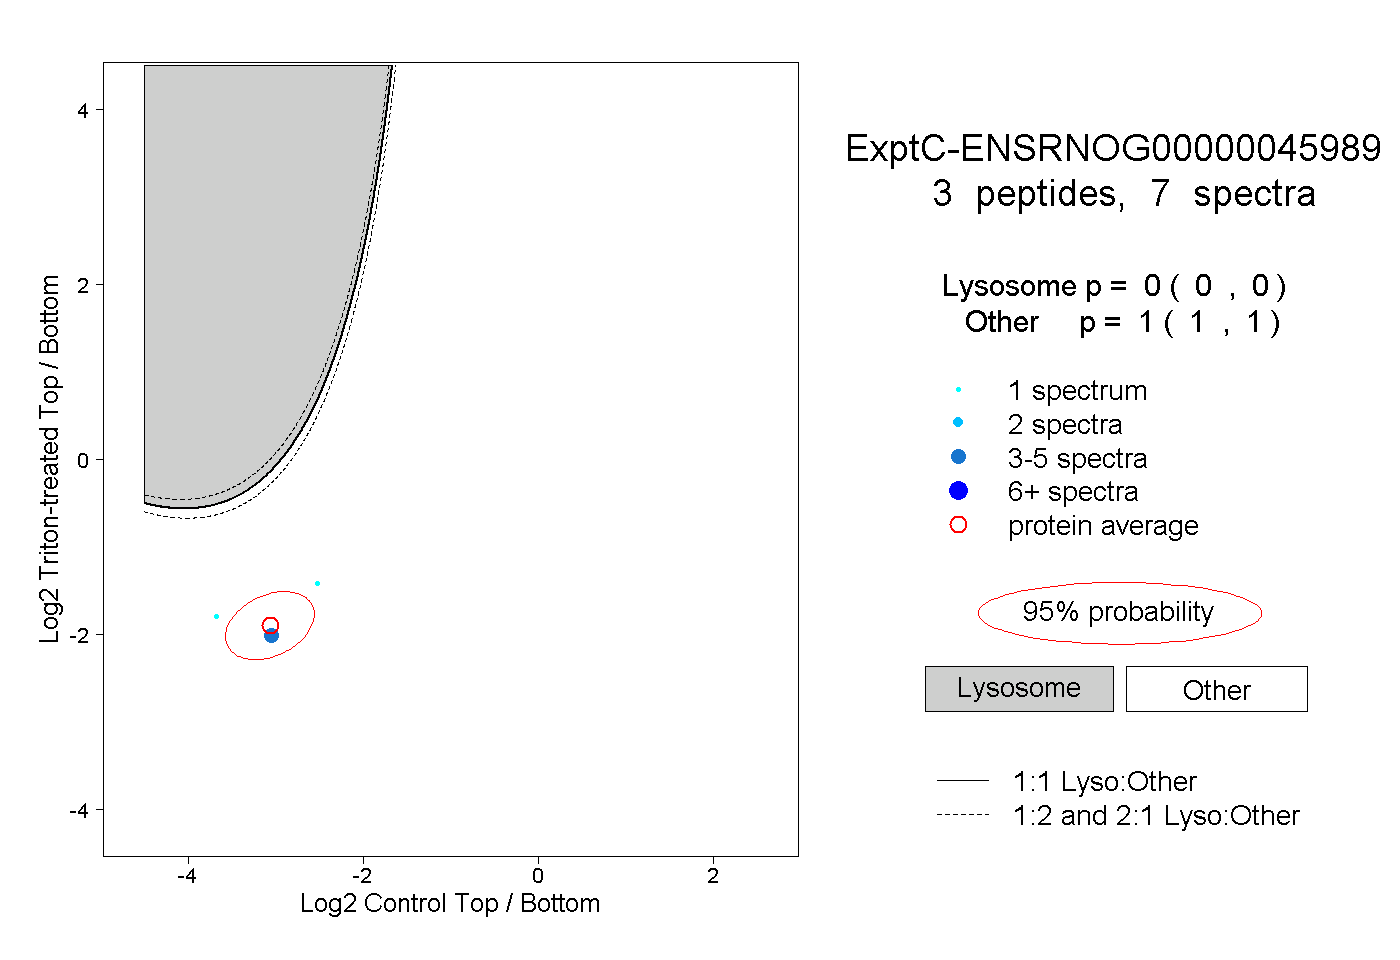
0.000 | 0.000
1.000 | 1.000