 4
4peptides
spectra
0.000 | 0.000
0.000 | 0.000
0.000 | 0.000
0.383 | 0.410
0.000 | 0.000
0.000 | 0.000
0.320 | 0.348
0.254 | 0.279
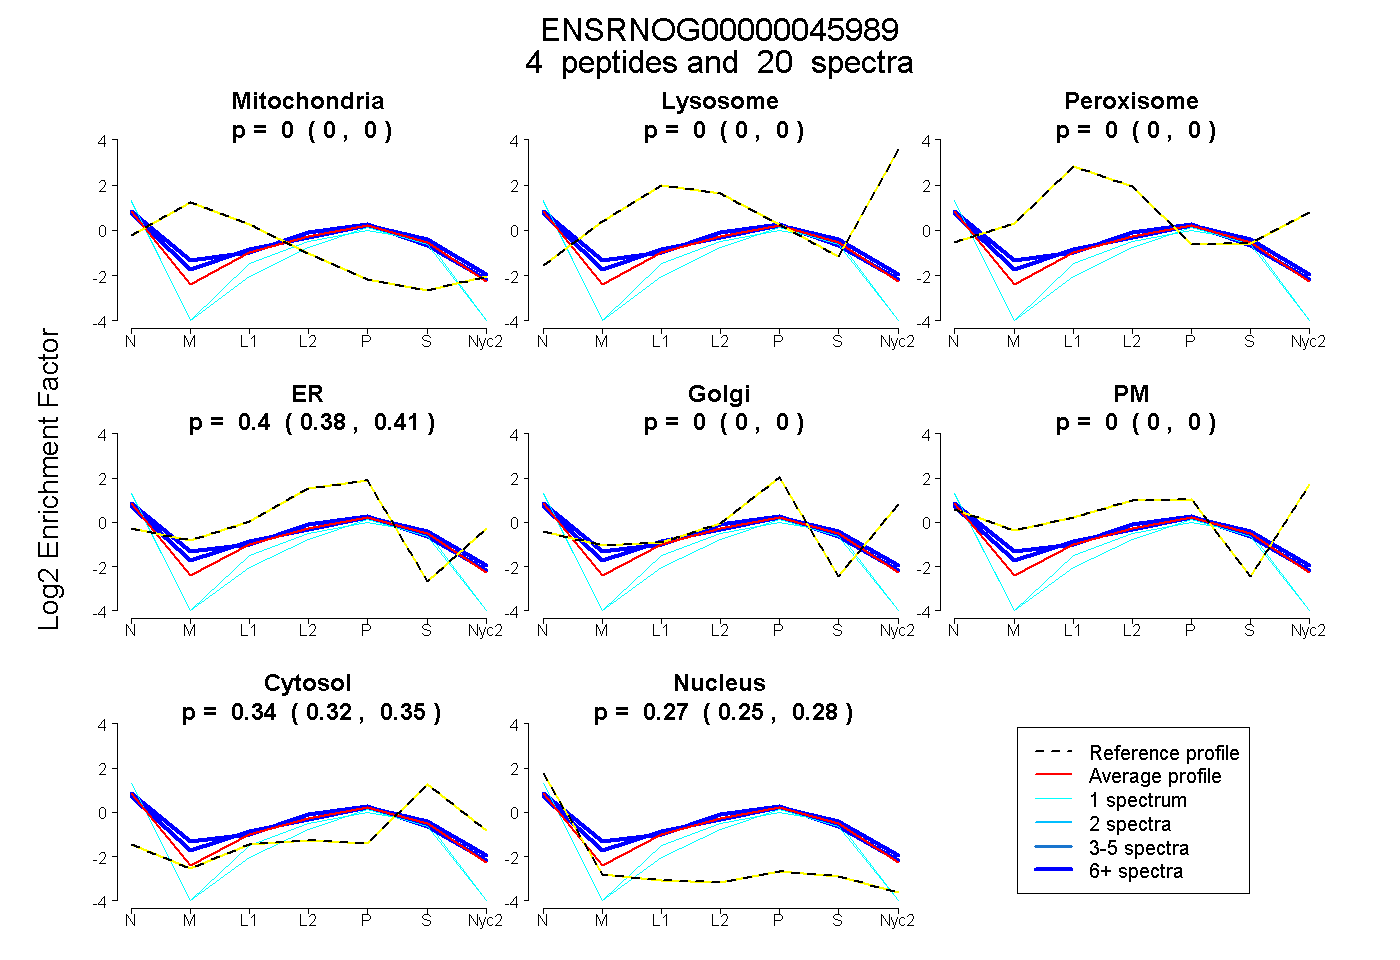
| Plot | Mito | Lyso | Perox | ER | Golgi | PM | Cytosol | Nucleus | |||||
| Expt A |
4 peptides |
20 spectra |
|
0.000 0.000 | 0.000 |
0.000 0.000 | 0.000 |
0.000 0.000 | 0.000 |
0.397 0.383 | 0.410 |
0.000 0.000 | 0.000 |
0.000 0.000 | 0.000 |
0.335 0.320 | 0.348 |
0.267 0.254 | 0.279 |
| 1 spectrum, TYFPHFNTSEGSDQVK | 0.000 | 0.000 | 0.000 | 0.213 | 0.000 | 0.000 | 0.262 | 0.525 | ||
| 1 spectrum, FFASVSTVLTSK | 0.000 | 0.000 | 0.000 | 0.229 | 0.000 | 0.000 | 0.295 | 0.475 | ||
| 8 spectra, IGNHAAEIGAETIGR | 0.000 | 0.000 | 0.059 | 0.427 | 0.000 | 0.000 | 0.246 | 0.268 | ||
| 10 spectra, LFIVFPSSK | 0.000 | 0.000 | 0.045 | 0.388 | 0.000 | 0.000 | 0.334 | 0.233 |
| Plot | Mito | Lyso or Perox | ER | Golgi | PM | Cytosol | Nucleus | ||||||
| Expt B |
2 peptides |
9 spectra |
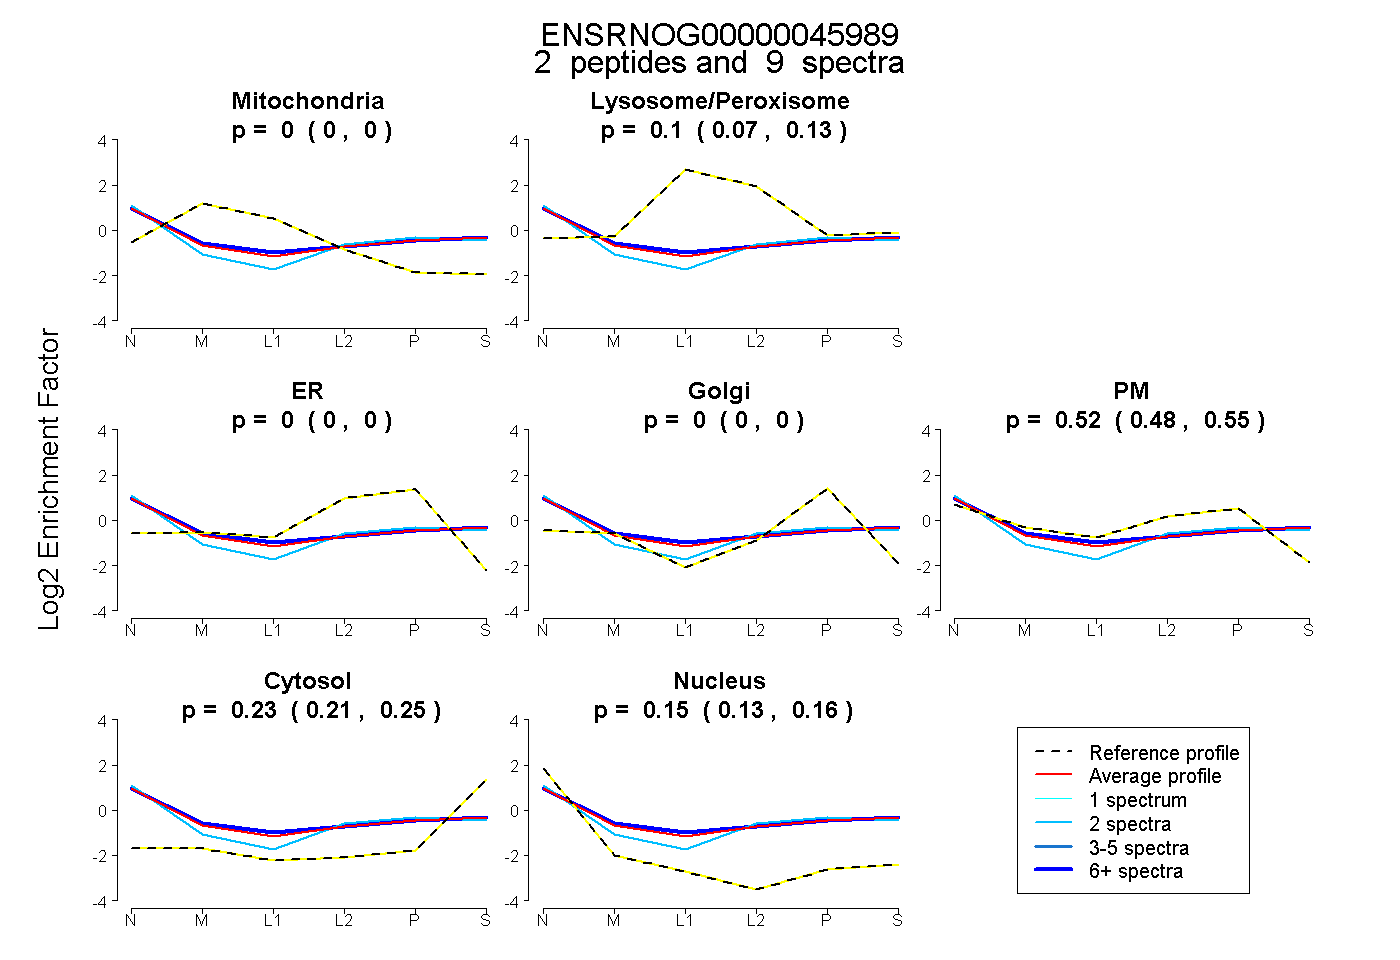 |
0.000 0.000 | 0.000 |
0.102 0.069 | 0.131 |
0.000 0.000 | 0.000 |
0.000 0.000 | 0.000 |
0.518 0.482 | 0.549 |
0.230 0.209 | 0.248 |
0.150 0.131 | 0.165 |
|||
| Plot | Lyso | Other | |||||||||||
| Expt C |
3 peptides |
7 spectra |
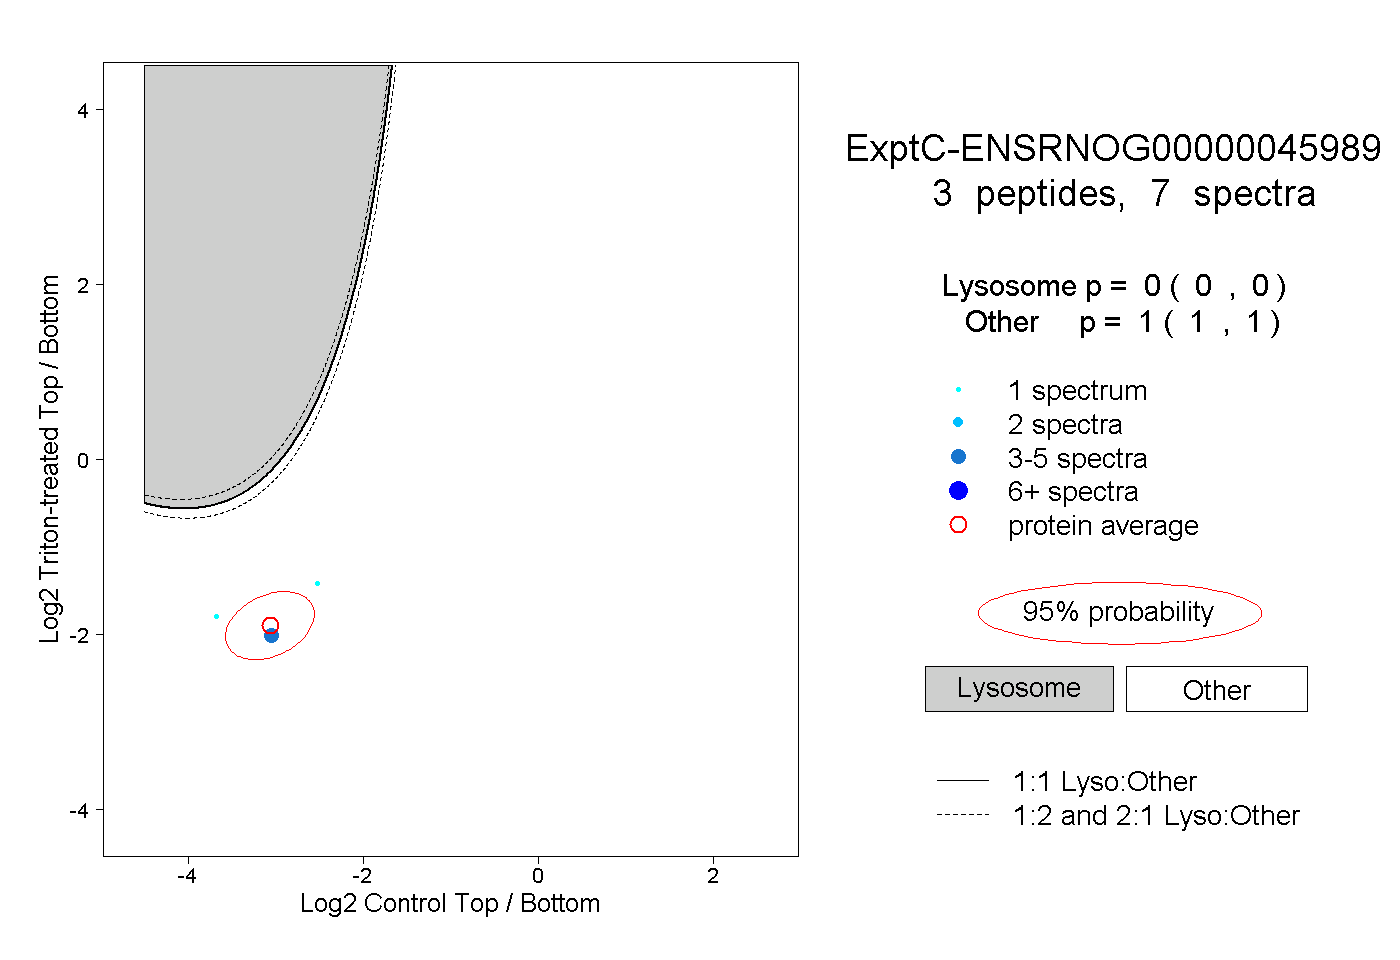 |
0.000 0.000 | 0.000 |
1.000 1.000 | 1.000 |