 10
10peptides
spectra
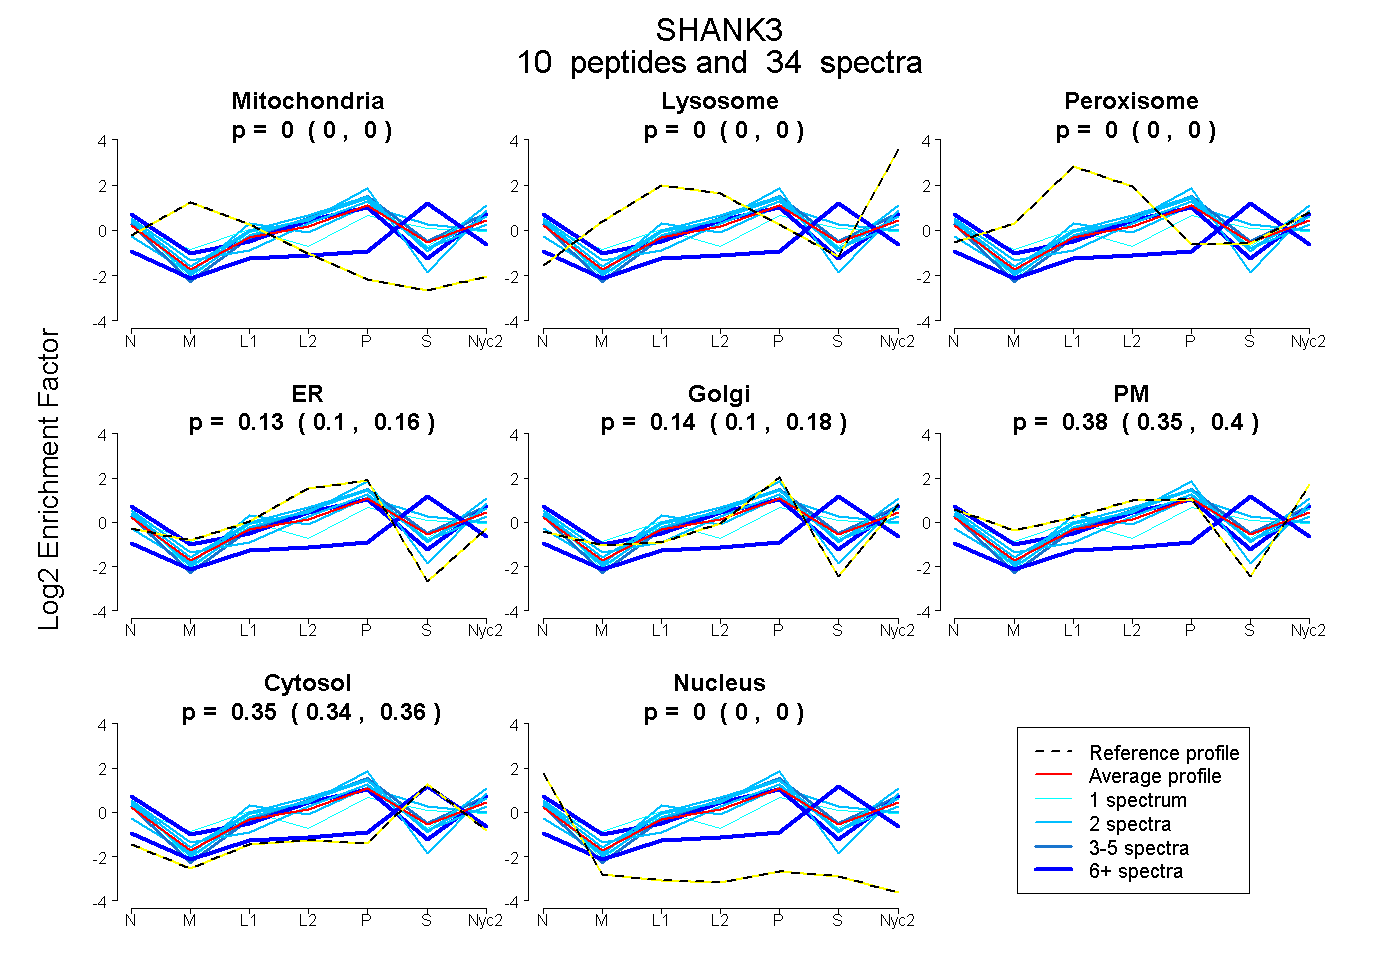
0.000 | 0.000
0.000 | 0.000
0.000 | 0.000
0.099 | 0.157
0.104 | 0.177
0.348 | 0.401
0.338 | 0.364
0.000 | 0.000
3peptides
spectra
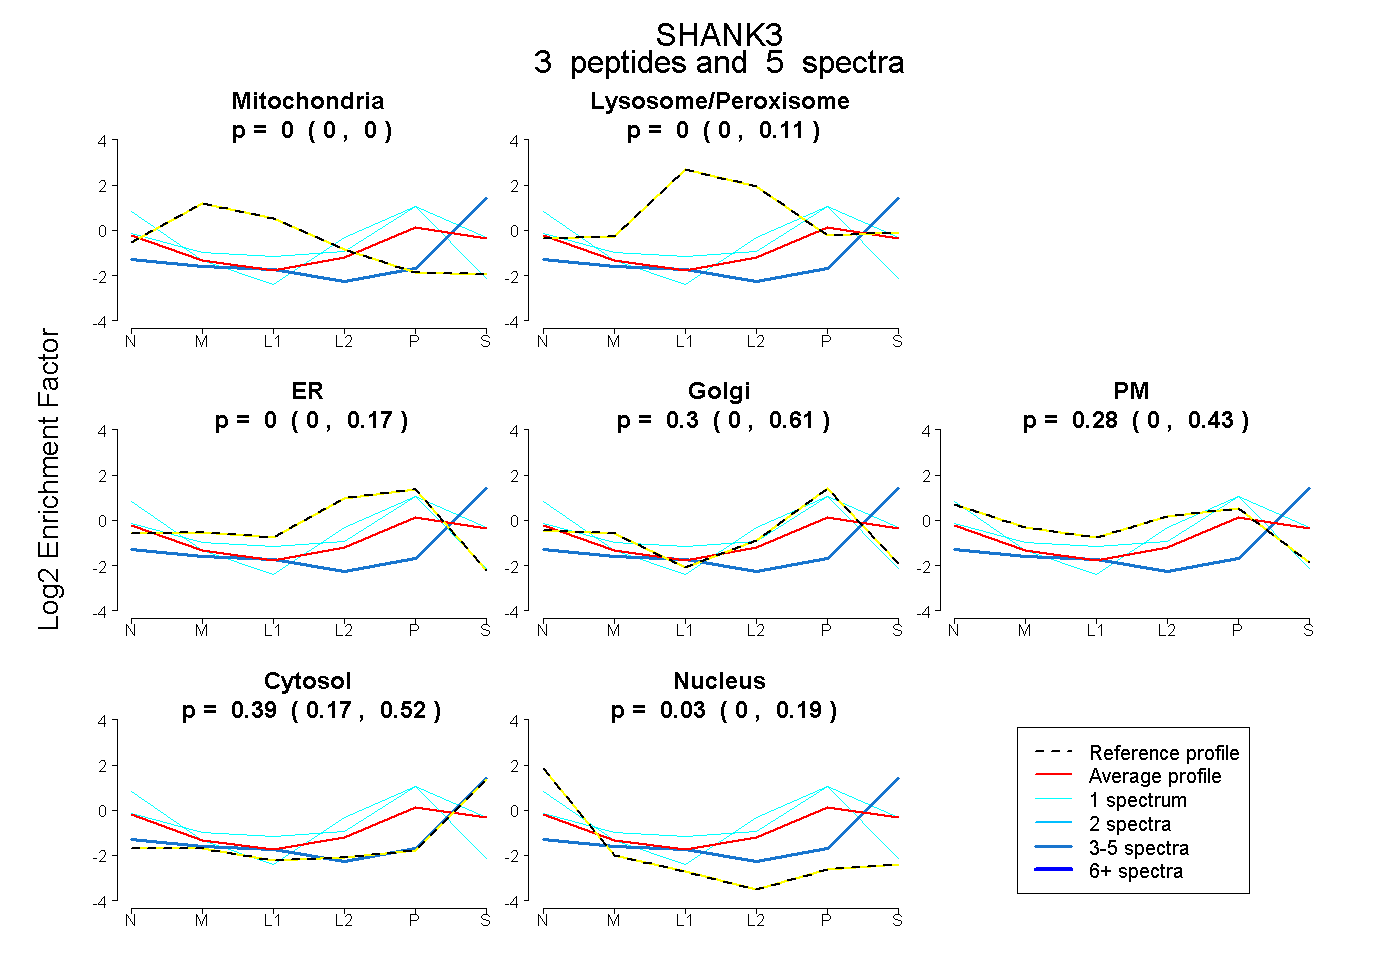
0.000 | 0.000
0.000 | 0.106
0.000 | 0.173
0.000 | 0.605
0.000 | 0.427
0.169 | 0.520
0.000 | 0.188
6peptides
spectra
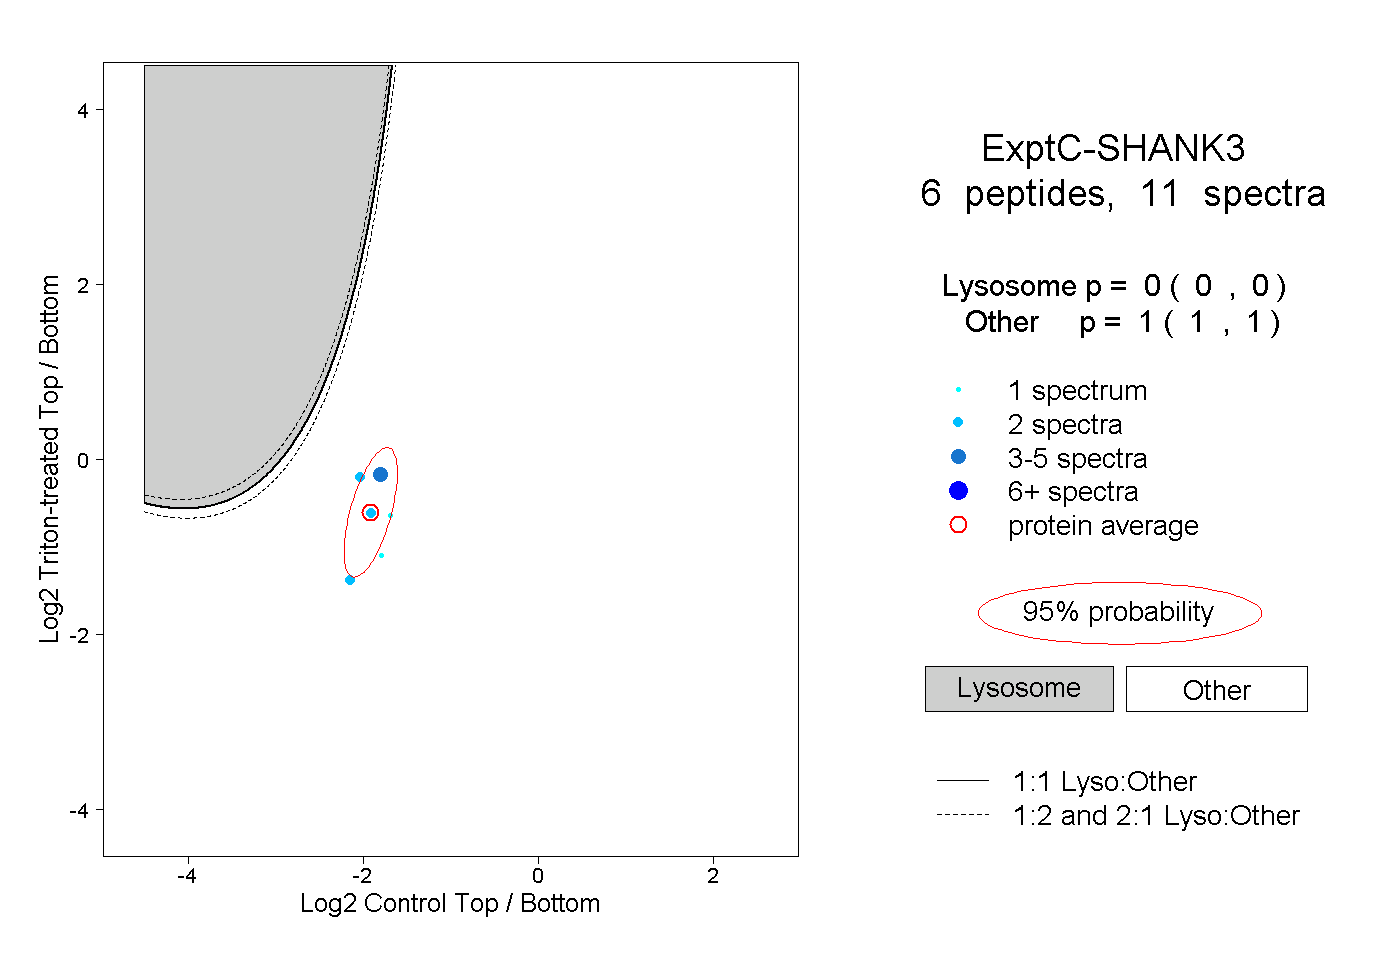
0.000 | 0.000
1.000 | 1.000