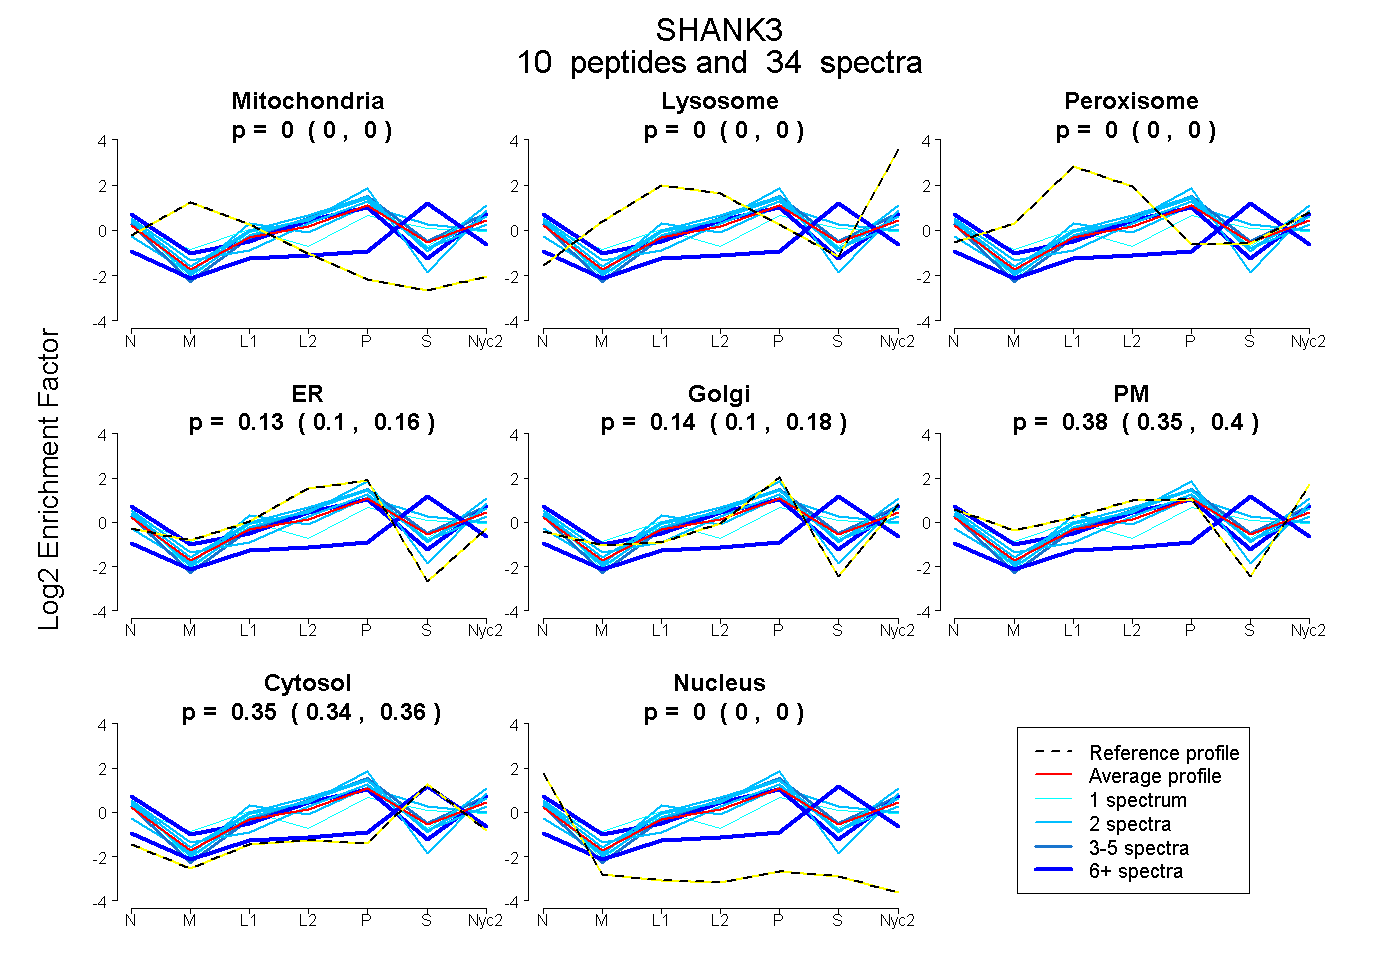
 10
10peptides
spectra
0.000 | 0.000
0.000 | 0.000
0.000 | 0.000
0.099 | 0.157
0.104 | 0.177
0.348 | 0.401
0.338 | 0.364
0.000 | 0.000
| Plot | Mito | Lyso | Perox | ER | Golgi | PM | Cytosol | Nucleus | |||||
| Expt A |
10 peptides |
34 spectra |
|
0.000 0.000 | 0.000 |
0.000 0.000 | 0.000 |
0.000 0.000 | 0.000 |
0.130 0.099 | 0.157 |
0.142 0.104 | 0.177 |
0.376 0.348 | 0.401 |
0.352 0.338 | 0.364 |
0.000 0.000 | 0.000 |
| 6 spectra, FLDEER | 0.000 | 0.000 | 0.000 | 0.076 | 0.089 | 0.606 | 0.203 | 0.026 | ||
| 1 spectrum, AHSPQGEGEIPLHR | 0.000 | 0.000 | 0.228 | 0.000 | 0.339 | 0.047 | 0.362 | 0.025 | ||
| 2 spectra, SLPHQLLLQR | 0.000 | 0.000 | 0.000 | 0.165 | 0.427 | 0.322 | 0.086 | 0.000 | ||
| 2 spectra, ITPAEISSLFER | 0.000 | 0.000 | 0.000 | 0.105 | 0.111 | 0.573 | 0.211 | 0.000 | ||
| 1 spectrum, GPLASPAFSPR | 0.000 | 0.000 | 0.000 | 0.066 | 0.168 | 0.505 | 0.261 | 0.000 | ||
| 12 spectra, YLFQR | 0.000 | 0.000 | 0.005 | 0.000 | 0.000 | 0.102 | 0.893 | 0.000 | ||
| 2 spectra, AALAVGSPGPVGGSFAR | 0.000 | 0.000 | 0.206 | 0.102 | 0.292 | 0.000 | 0.399 | 0.000 | ||
| 4 spectra, ALASQTPSR | 0.000 | 0.000 | 0.000 | 0.160 | 0.203 | 0.331 | 0.306 | 0.000 | ||
| 2 spectra, QLQVEDAQER | 0.000 | 0.000 | 0.000 | 0.335 | 0.090 | 0.289 | 0.286 | 0.000 | ||
| 2 spectra, QVVGLIR | 0.000 | 0.000 | 0.000 | 0.022 | 0.315 | 0.393 | 0.270 | 0.000 |
| Plot | Mito | Lyso or Perox | ER | Golgi | PM | Cytosol | Nucleus | ||||||
| Expt B |
3 peptides |
5 spectra |
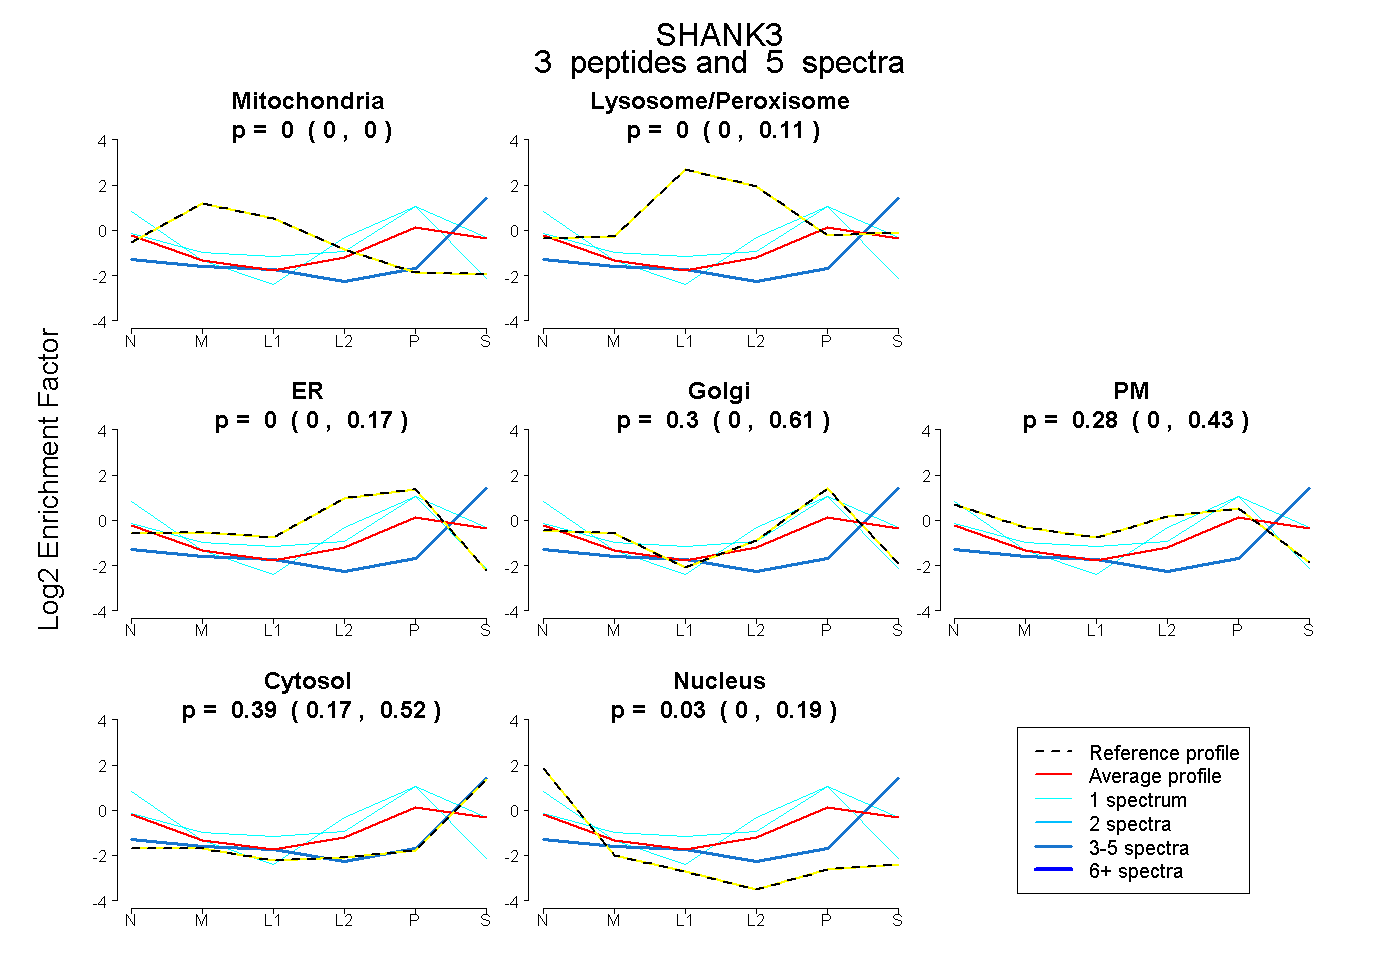 |
0.000 0.000 | 0.000 |
0.000 0.000 | 0.106 |
0.000 0.000 | 0.173 |
0.301 0.000 | 0.605 |
0.282 0.000 | 0.427 |
0.389 0.169 | 0.520 |
0.028 0.000 | 0.188 |
|||
| Plot | Lyso | Other | |||||||||||
| Expt C |
6 peptides |
11 spectra |
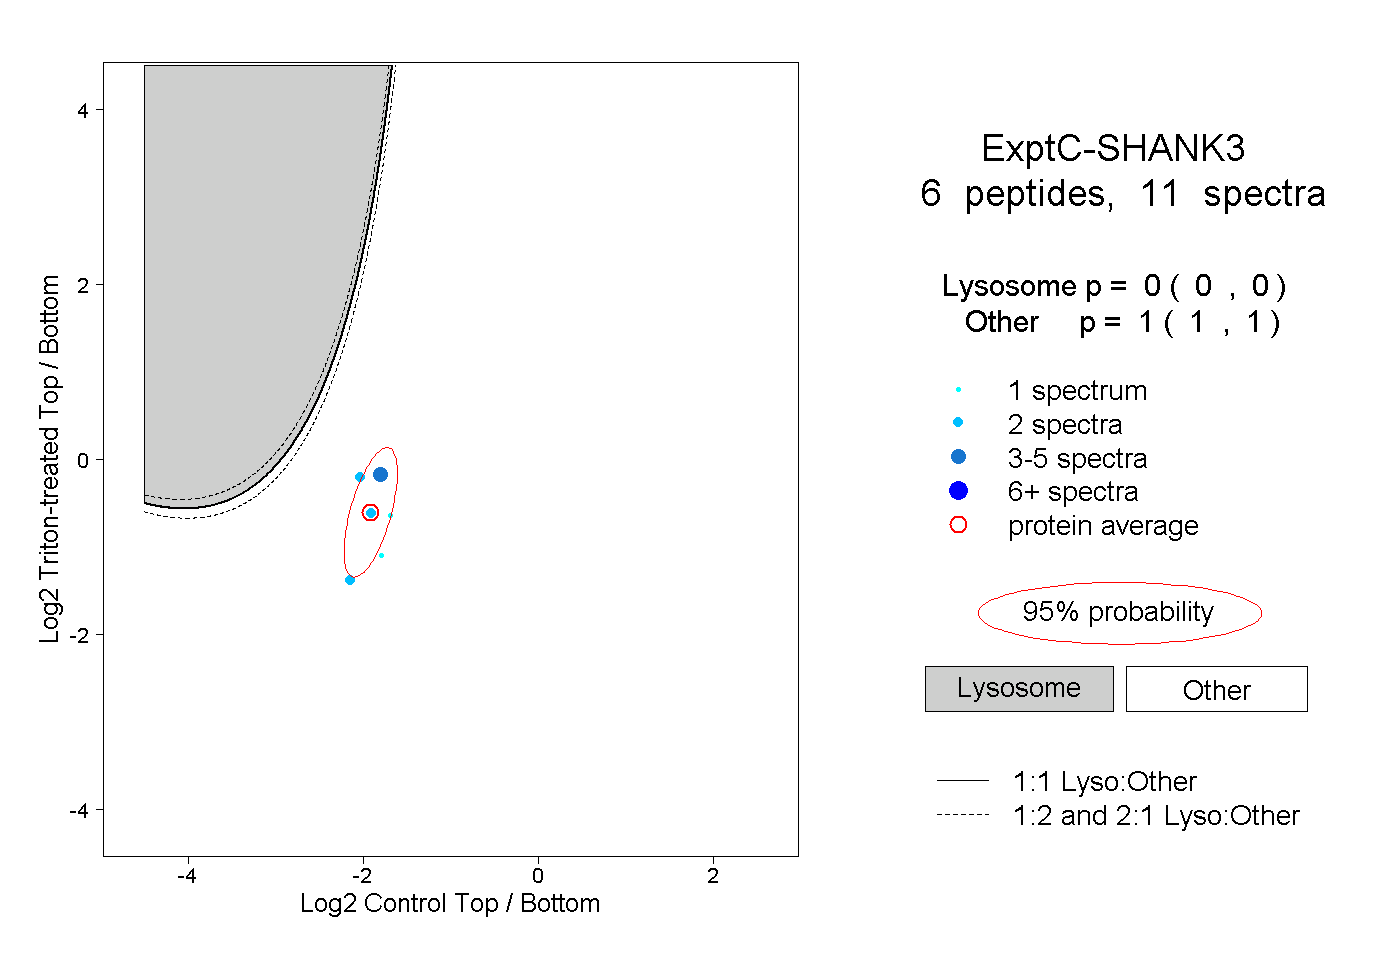 |
0.000 0.000 | 0.000 |
1.000 1.000 | 1.000 |