 10
10peptides
spectra
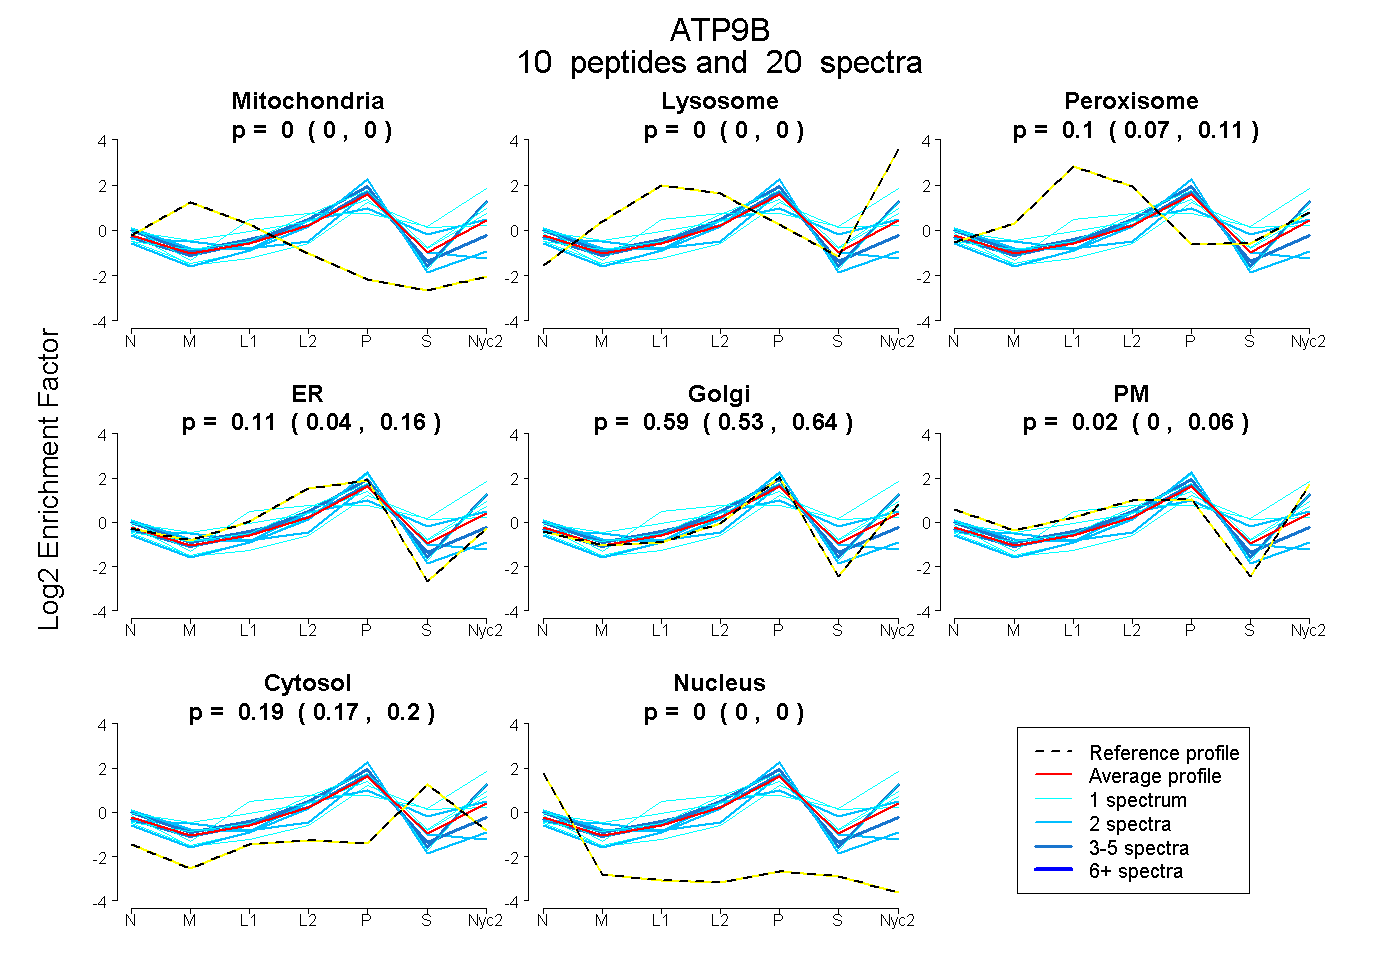
0.000 | 0.000
0.000 | 0.000
0.073 | 0.114
0.044 | 0.158
0.531 | 0.637
0.000 | 0.063
0.167 | 0.201
0.000 | 0.000
13peptides
spectra
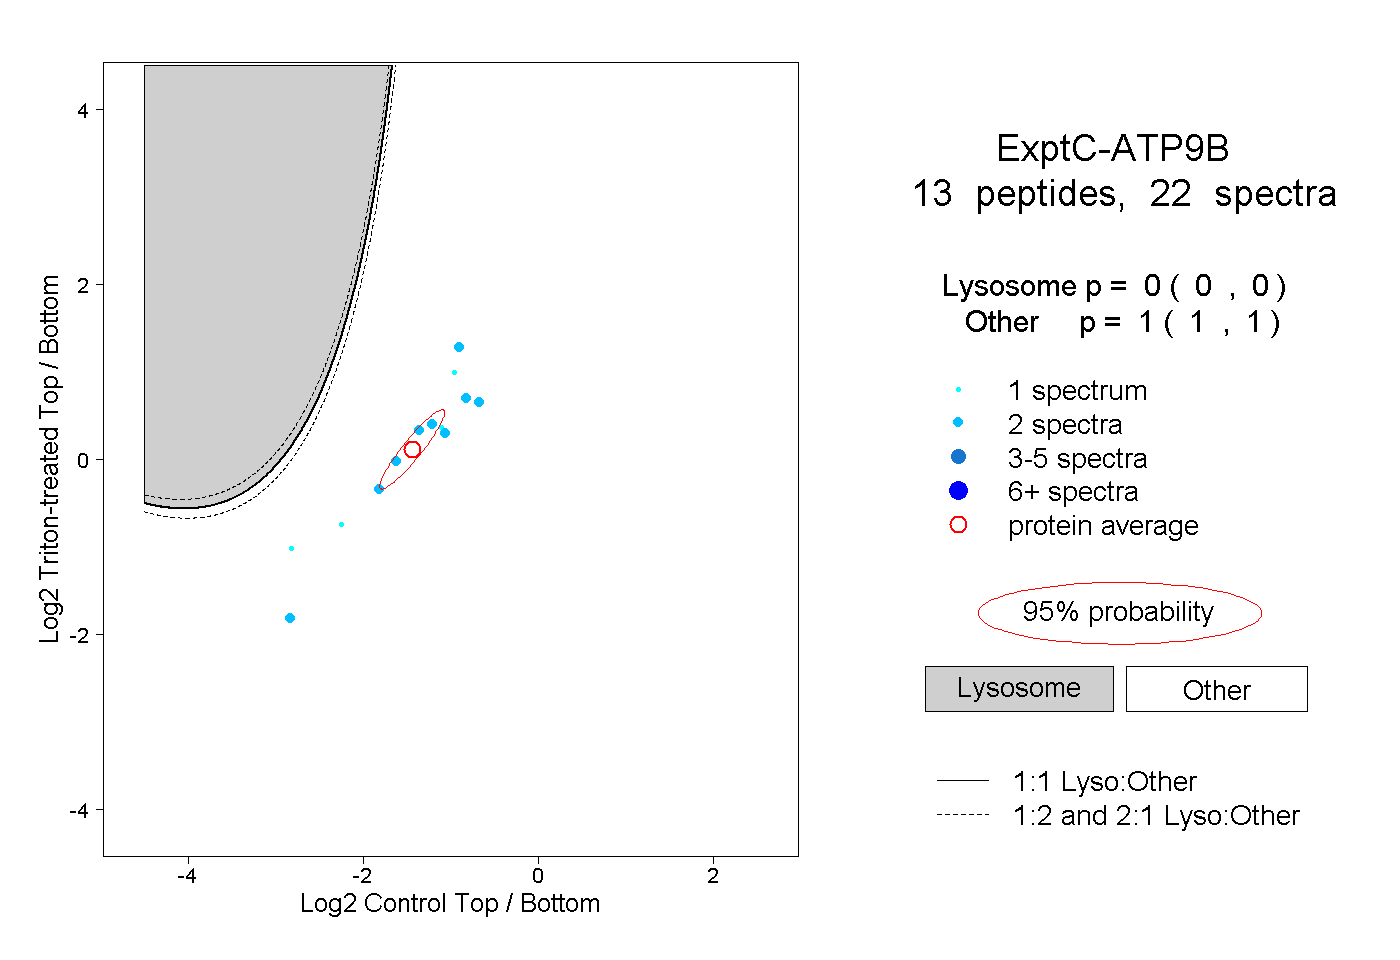
0.000 | 0.000
1.000 | 1.000
4peptides
spectra
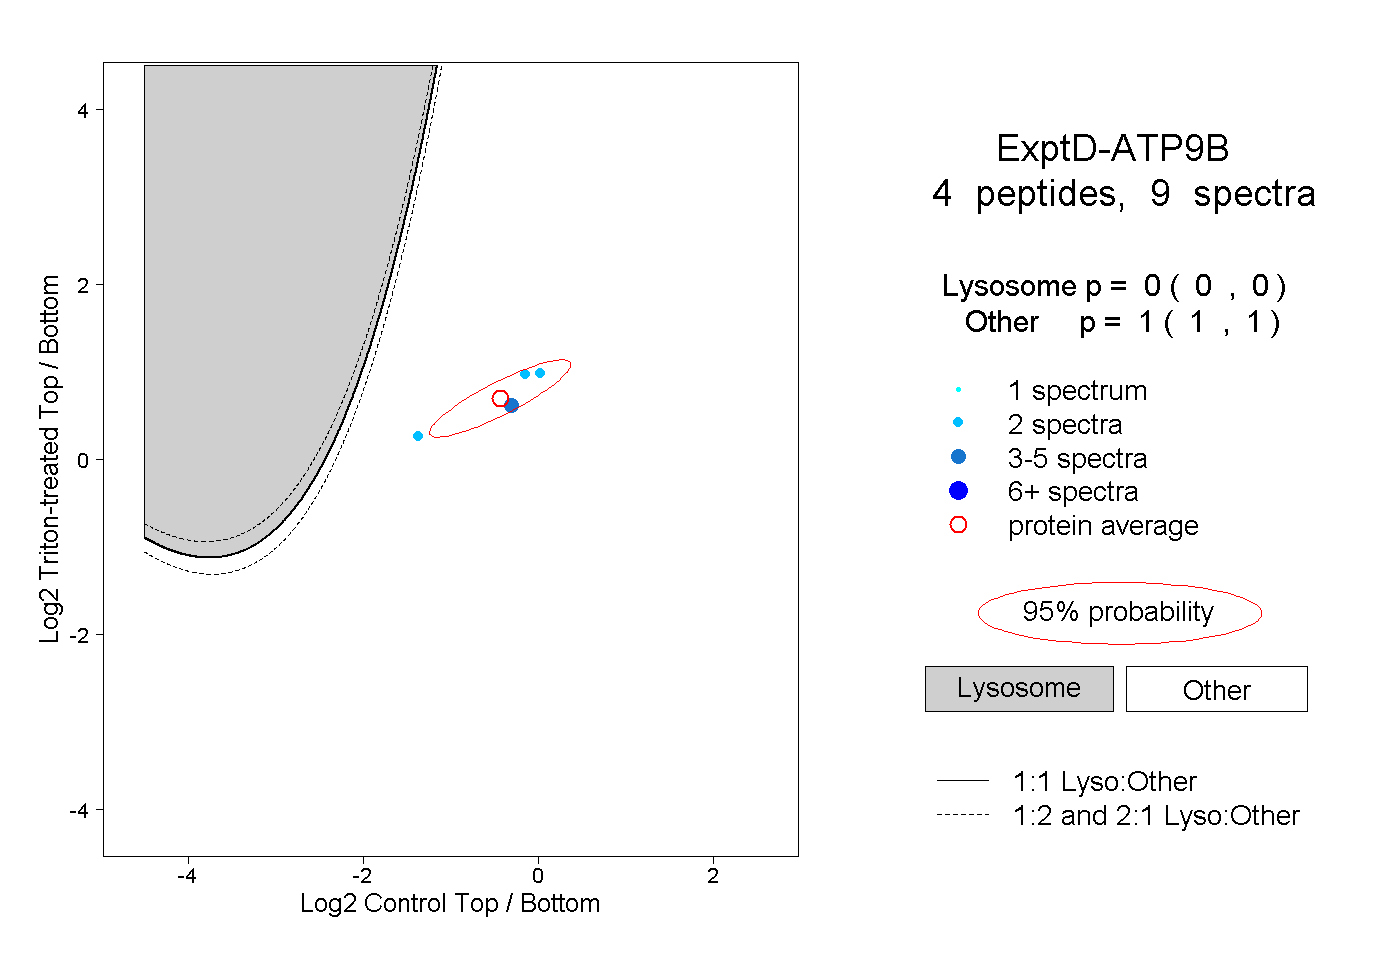
0.000 | 0.000
1.000 | 1.000