 10
10peptides
spectra
0.000 | 0.000
0.000 | 0.000
0.073 | 0.114
0.044 | 0.158
0.531 | 0.637
0.000 | 0.063
0.167 | 0.201
0.000 | 0.000
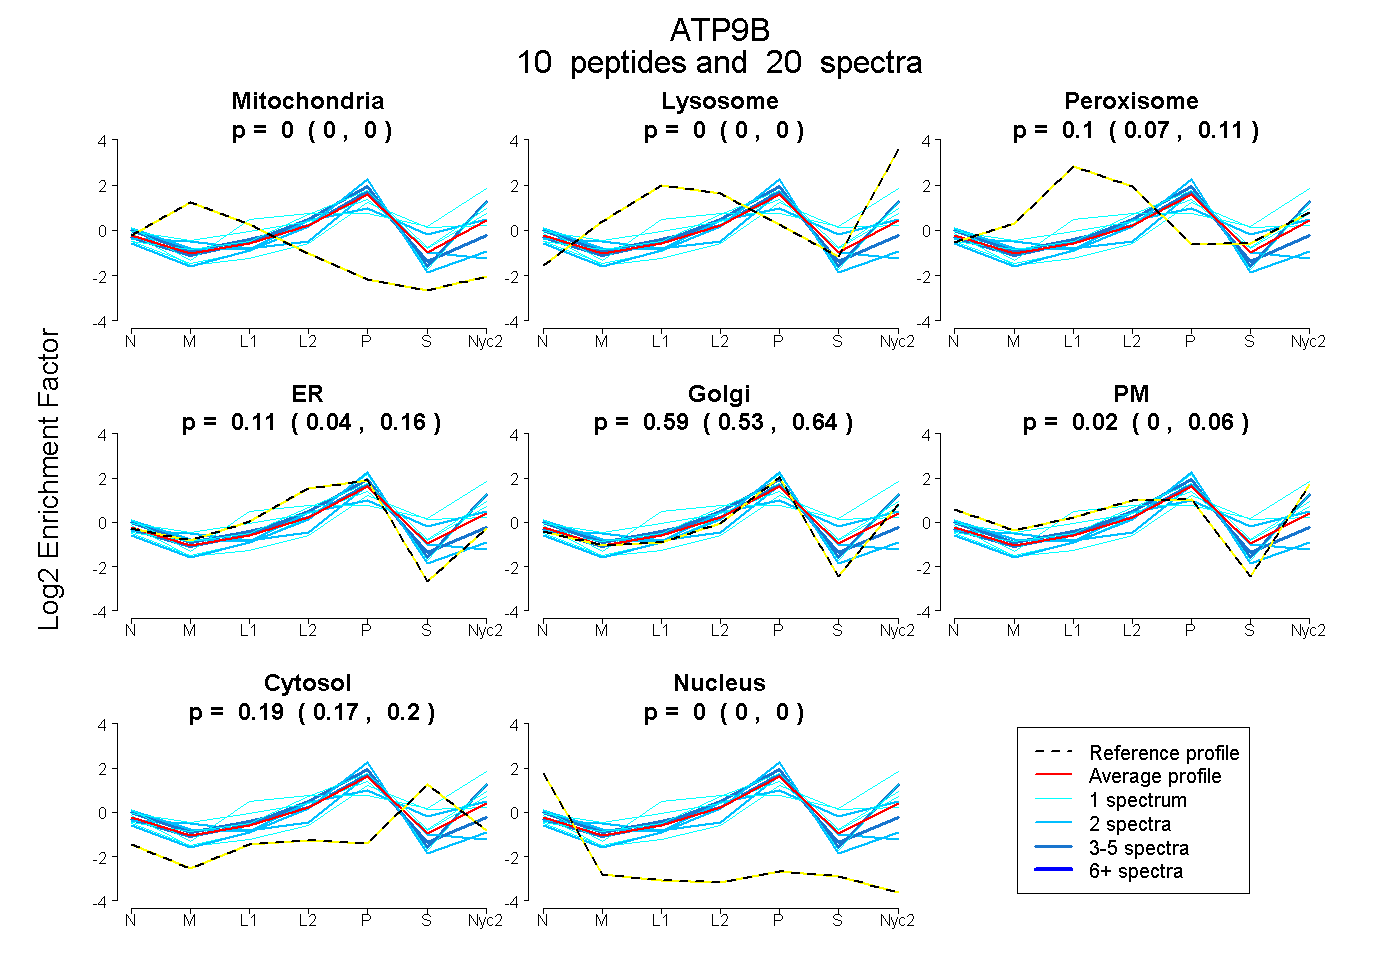
| Plot | Mito | Lyso | Perox | ER | Golgi | PM | Cytosol | Nucleus | |||||
| Expt A |
10 peptides |
20 spectra |
|
0.000 0.000 | 0.000 |
0.000 0.000 | 0.000 |
0.095 0.073 | 0.114 |
0.107 0.044 | 0.158 |
0.590 0.531 | 0.637 |
0.023 0.000 | 0.063 |
0.185 0.167 | 0.201 |
0.000 0.000 | 0.000 |
| 2 spectra, AIALCHNVTPVYEAR | 0.099 | 0.000 | 0.000 | 0.313 | 0.327 | 0.000 | 0.237 | 0.024 | ||
| 5 spectra, AHIVTLLR | 0.000 | 0.126 | 0.000 | 0.030 | 0.721 | 0.072 | 0.051 | 0.000 | ||
| 1 spectrum, VAAVVESLER | 0.000 | 0.060 | 0.000 | 0.000 | 0.888 | 0.000 | 0.052 | 0.000 | ||
| 2 spectra, TLTEEQYQDFESR | 0.000 | 0.000 | 0.000 | 0.111 | 0.082 | 0.443 | 0.364 | 0.000 | ||
| 1 spectrum, DENIPGTVVR | 0.000 | 0.000 | 0.000 | 0.000 | 0.539 | 0.021 | 0.439 | 0.000 | ||
| 1 spectrum, WTESVGLTLVSR | 0.000 | 0.184 | 0.000 | 0.185 | 0.467 | 0.000 | 0.163 | 0.000 | ||
| 4 spectra, SAAAAAASHR | 0.000 | 0.000 | 0.027 | 0.426 | 0.367 | 0.000 | 0.173 | 0.008 | ||
| 1 spectrum, TYQASSPDEVALVR | 0.000 | 0.287 | 0.026 | 0.000 | 0.000 | 0.383 | 0.303 | 0.000 | ||
| 2 spectra, VAVSCTQR | 0.000 | 0.000 | 0.000 | 0.460 | 0.357 | 0.000 | 0.122 | 0.060 | ||
| 1 spectrum, TQDIHIFRPVTNR | 0.000 | 0.000 | 0.240 | 0.000 | 0.519 | 0.119 | 0.121 | 0.000 |
| Plot | Lyso | Other | |||||||||||
| Expt C |
13 peptides |
22 spectra |
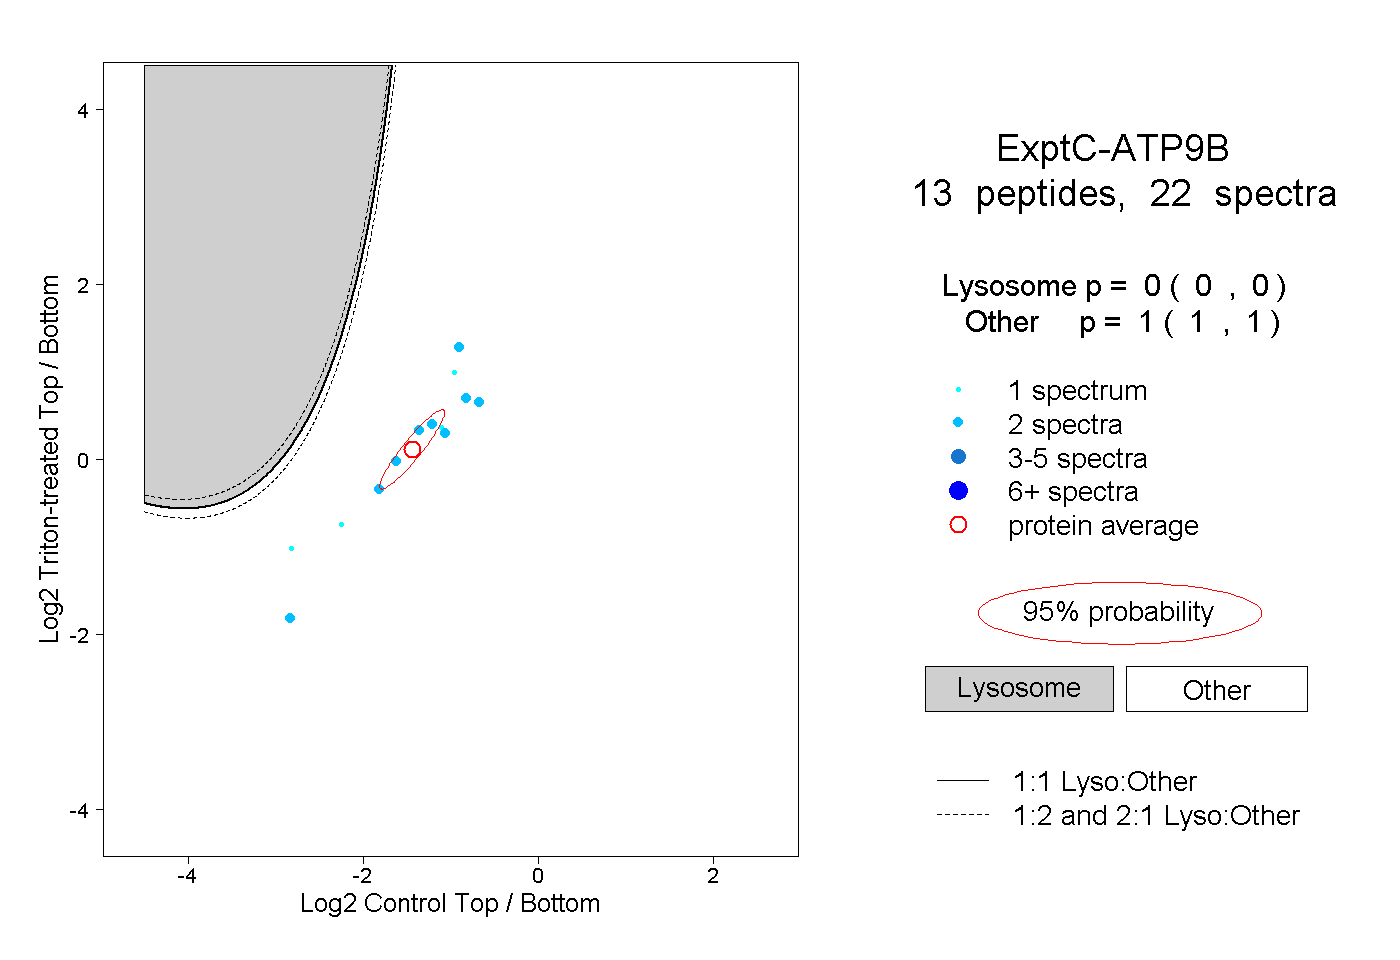 |
0.000 0.000 | 0.000 |
1.000 1.000 | 1.000 |
||||||||
| Plot | Lyso | Other | |||||||||||
| Expt D |
4 peptides |
9 spectra |
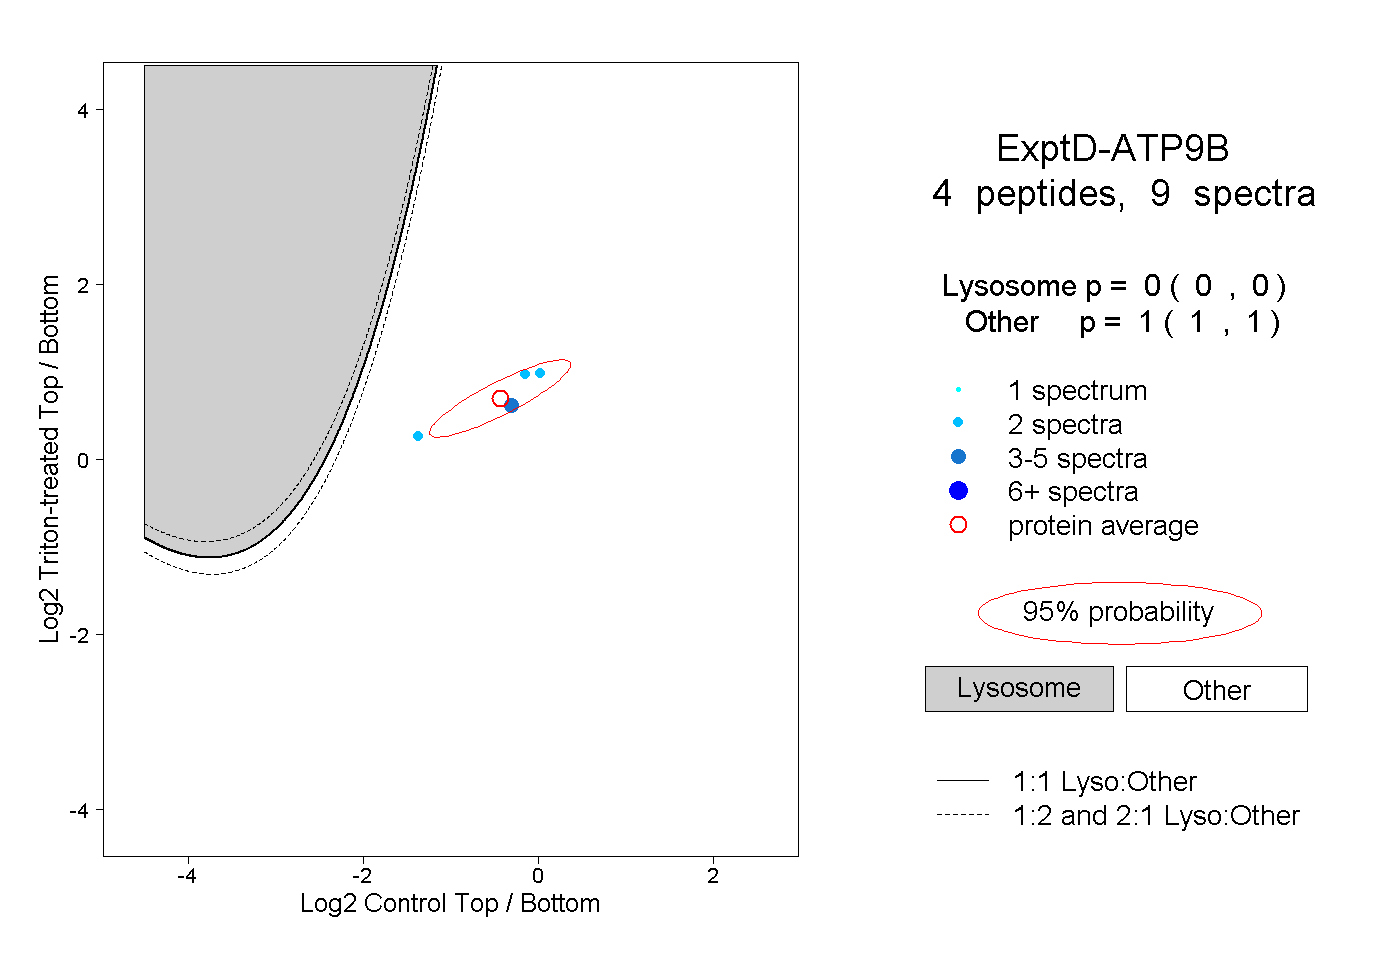 |
0.000 0.000 | 0.000 |
1.000 1.000 | 1.000 |