 11
11peptides
spectra
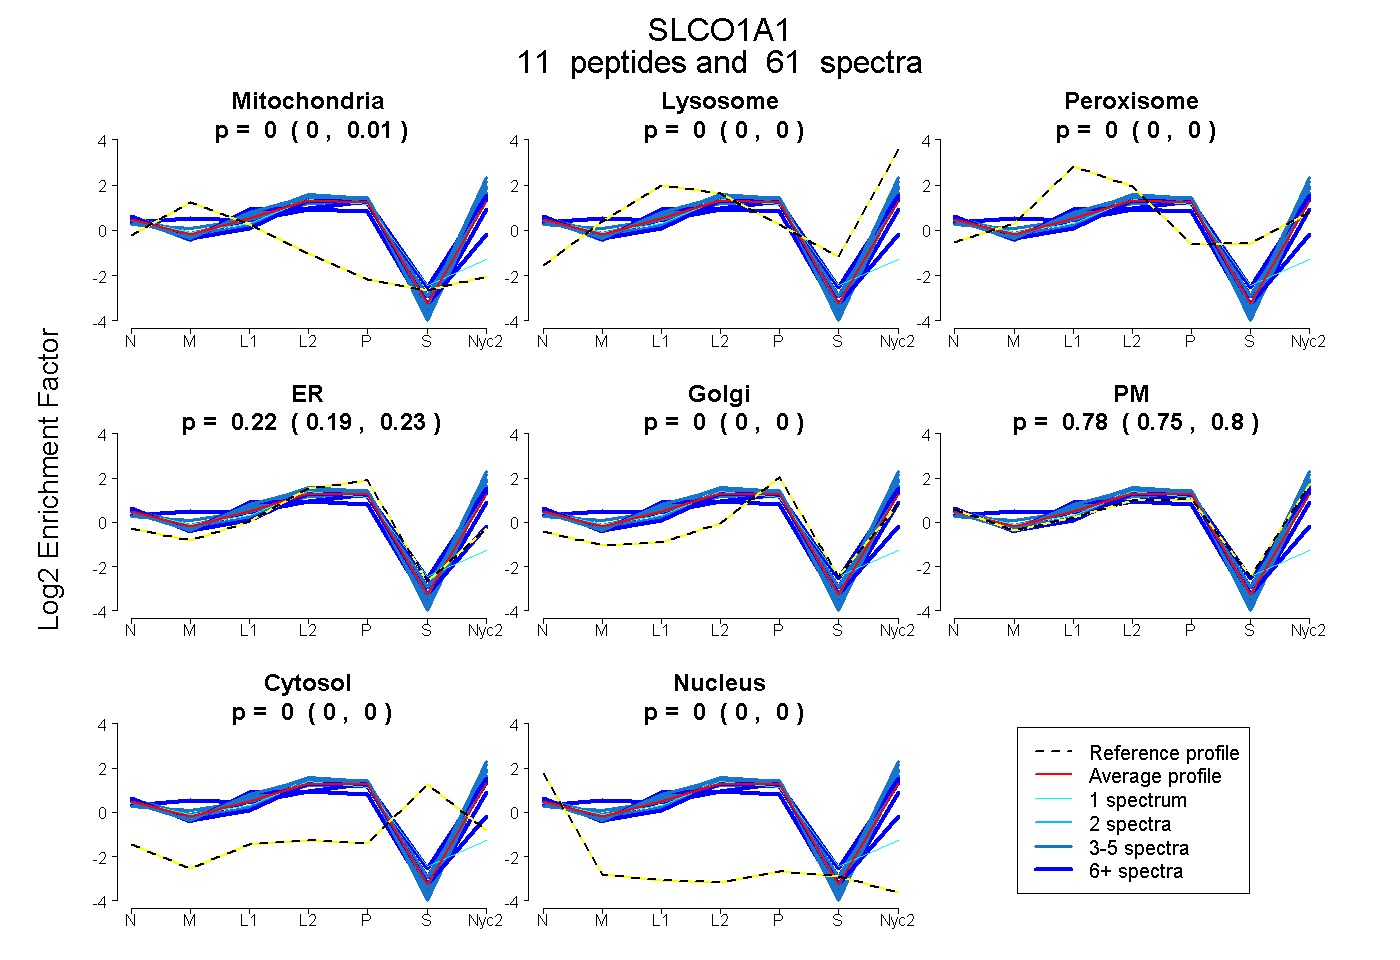
0.000 | 0.007
0.000 | 0.000
0.000 | 0.000
0.192 | 0.234
0.000 | 0.000
0.753 | 0.804
0.000 | 0.000
0.000 | 0.000
8peptides
spectra
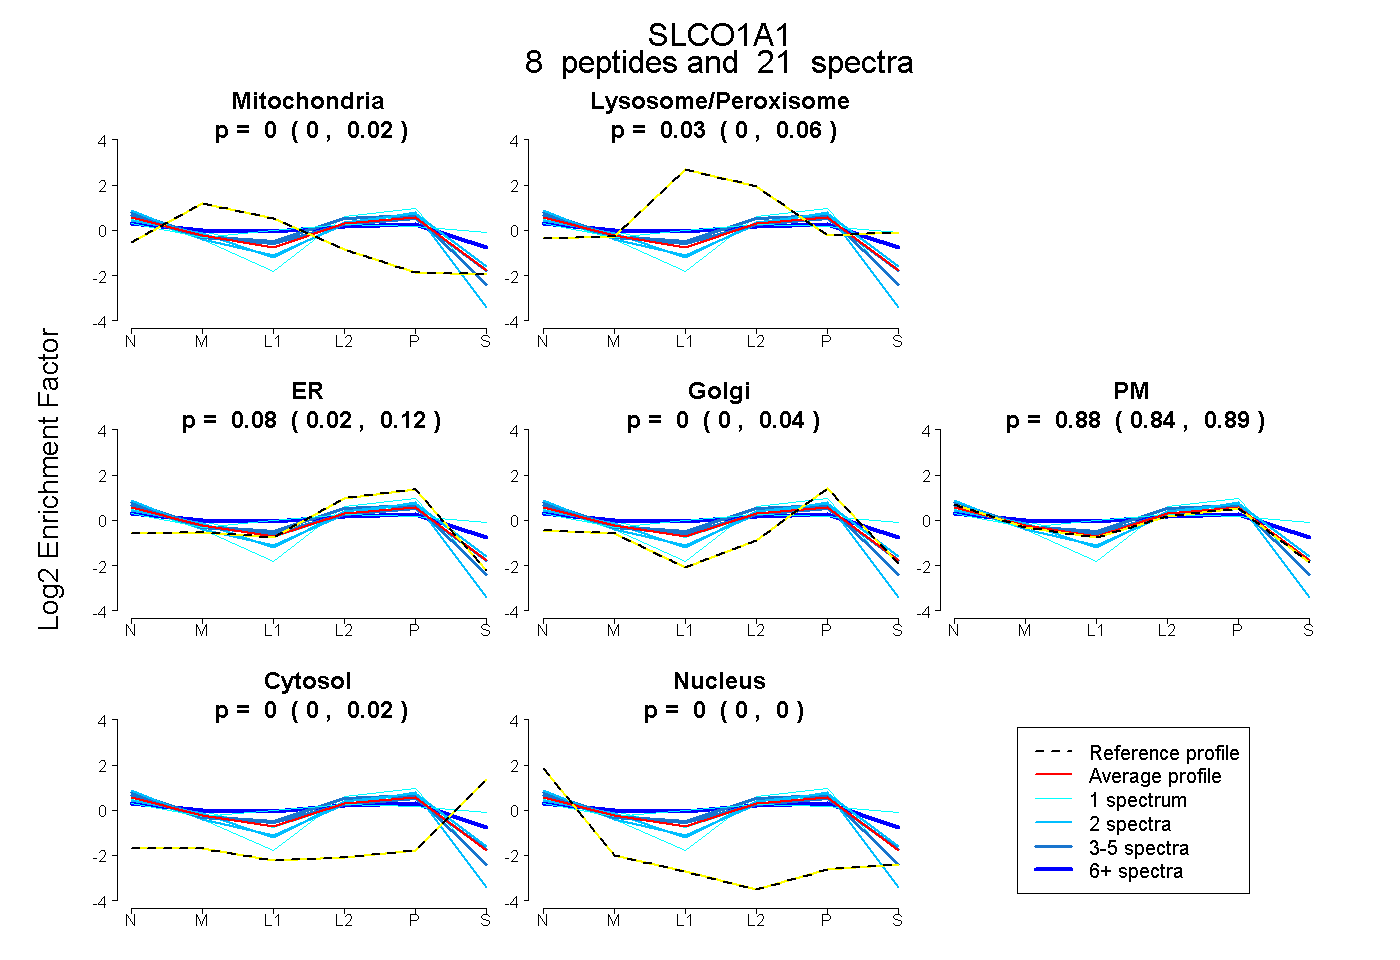
0.000 | 0.018
0.005 | 0.064
0.022 | 0.116
0.000 | 0.045
0.837 | 0.894
0.000 | 0.016
0.000 | 0.000
14peptides
spectra
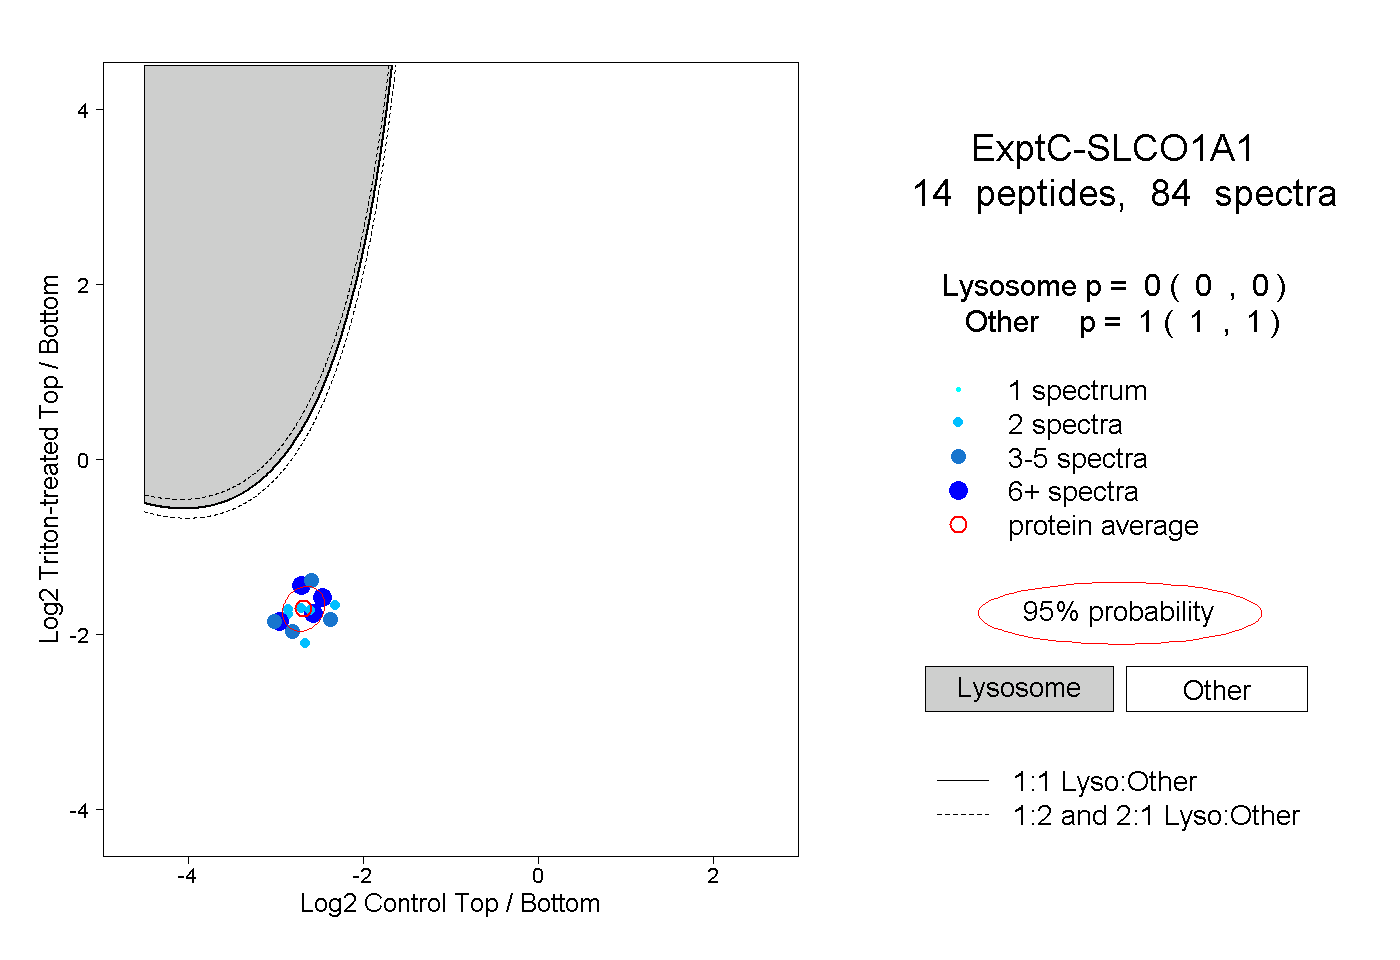
0.000 | 0.000
1.000 | 1.000
4peptides
spectra
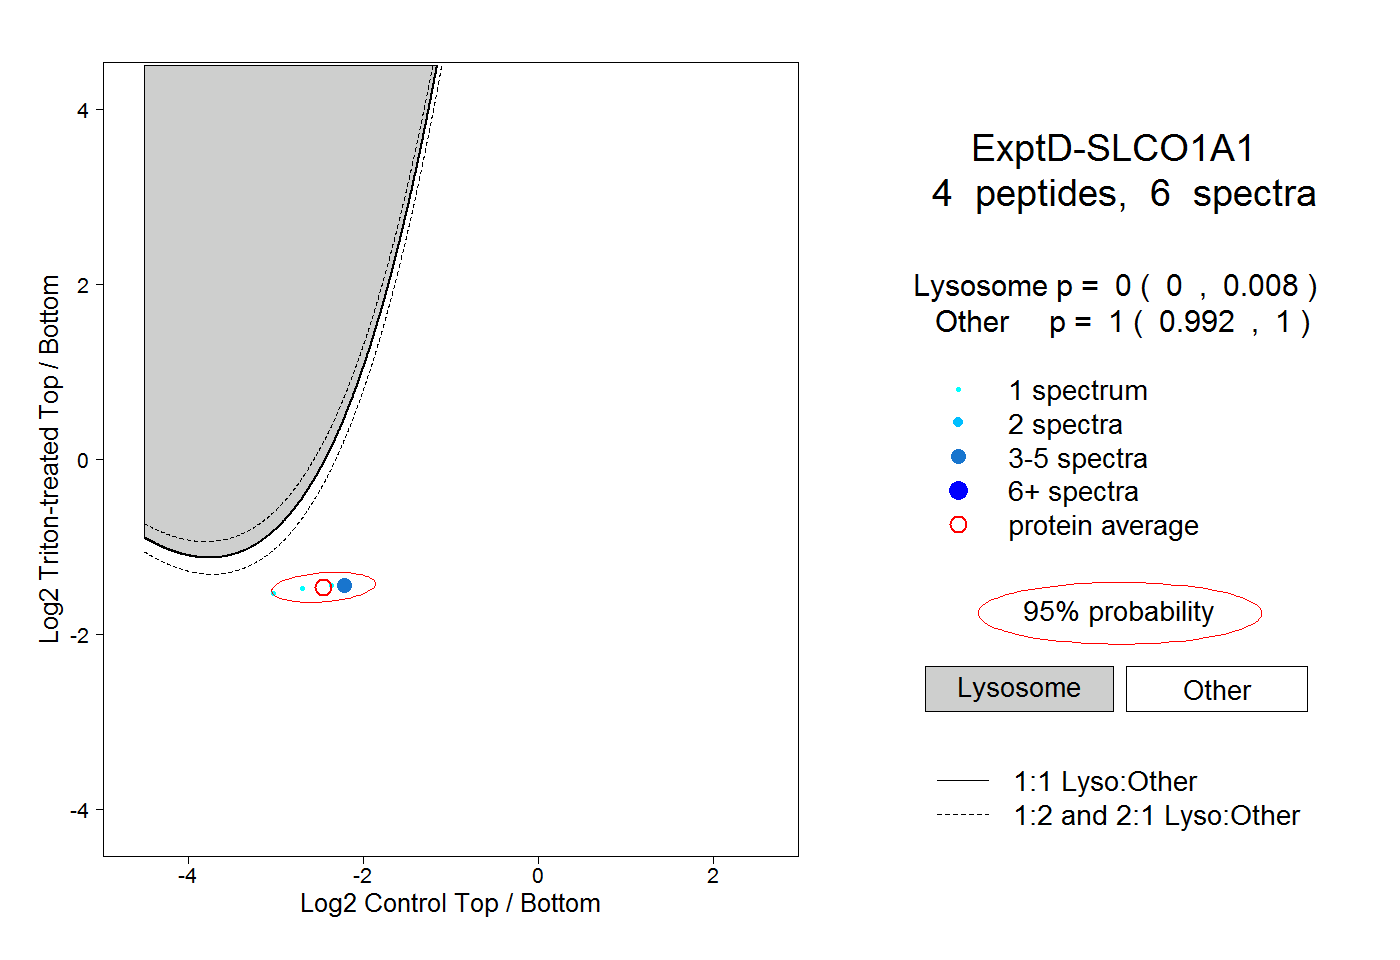
0.000 | 0.008
0.992 | 1.000