 11
11peptides
spectra
0.000 | 0.007
0.000 | 0.000
0.000 | 0.000
0.192 | 0.234
0.000 | 0.000
0.753 | 0.804
0.000 | 0.000
0.000 | 0.000
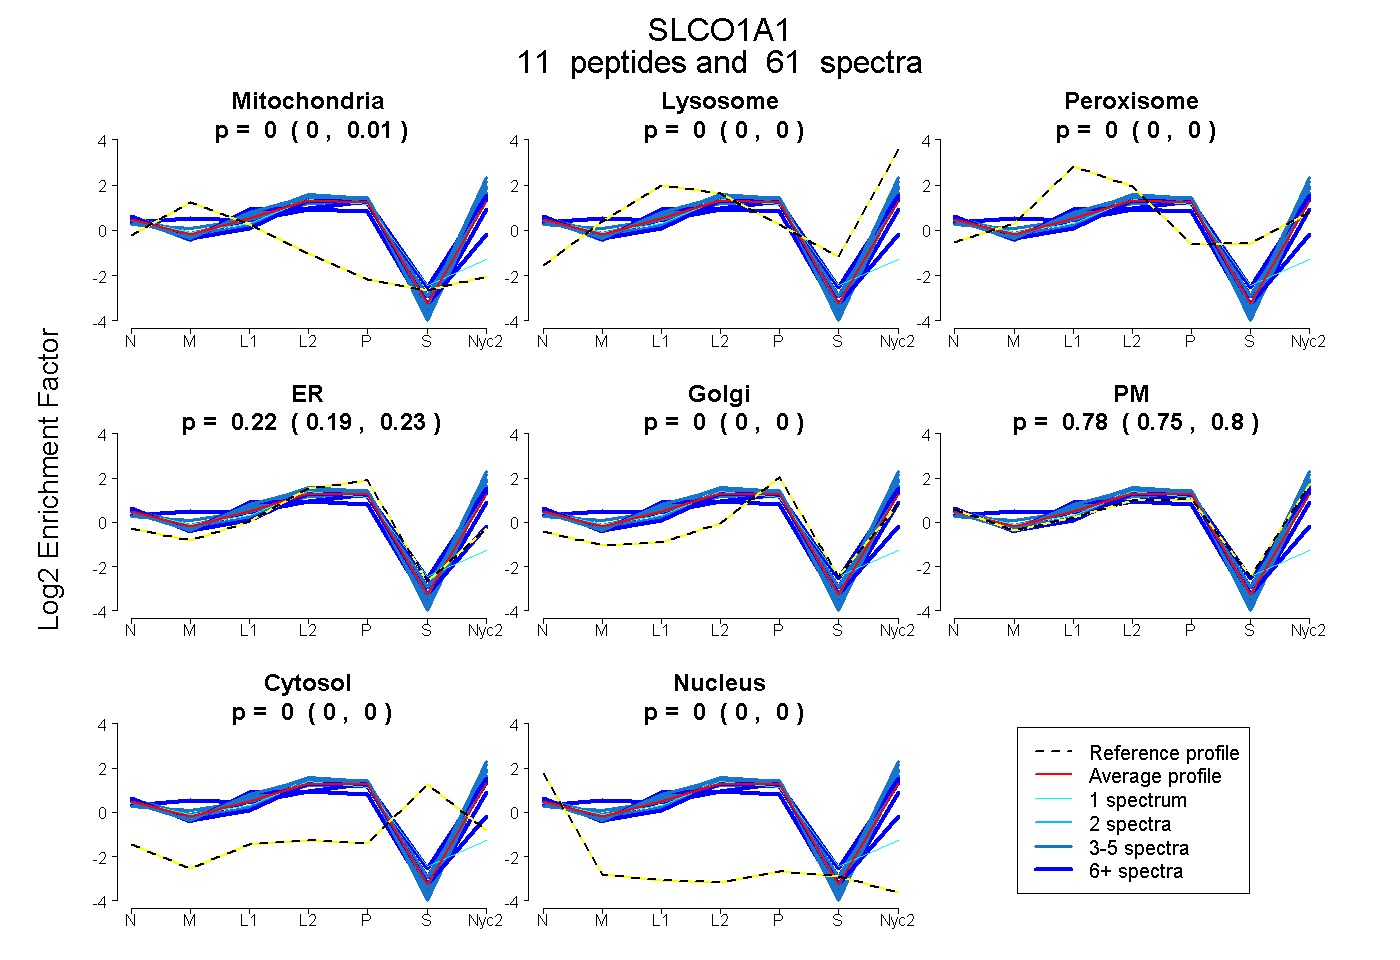
| Plot | Mito | Lyso | Perox | ER | Golgi | PM | Cytosol | Nucleus | |||||
| Expt A |
11 peptides |
61 spectra |
|
0.001 0.000 | 0.007 |
0.000 0.000 | 0.000 |
0.000 0.000 | 0.000 |
0.217 0.192 | 0.234 |
0.000 0.000 | 0.000 |
0.782 0.753 | 0.804 |
0.000 0.000 | 0.000 |
0.000 0.000 | 0.000 |
| 1 spectrum, VFLLSLTCACLTK | 0.222 | 0.000 | 0.011 | 0.766 | 0.000 | 0.000 | 0.000 | 0.001 | ||
| 8 spectra, EENLGITK | 0.165 | 0.000 | 0.000 | 0.135 | 0.000 | 0.700 | 0.000 | 0.000 | ||
| 5 spectra, SLSGVYMNSMLTQIER | 0.000 | 0.095 | 0.000 | 0.000 | 0.000 | 0.905 | 0.000 | 0.000 | ||
| 11 spectra, IATQEGR | 0.000 | 0.000 | 0.000 | 0.123 | 0.000 | 0.877 | 0.000 | 0.000 | ||
| 4 spectra, GPECANR | 0.000 | 0.000 | 0.000 | 0.082 | 0.000 | 0.918 | 0.000 | 0.000 | ||
| 3 spectra, GVQHQLHVESK | 0.000 | 0.071 | 0.000 | 0.098 | 0.000 | 0.832 | 0.000 | 0.000 | ||
| 11 spectra, SLGVGLHTFCIR | 0.140 | 0.000 | 0.000 | 0.573 | 0.000 | 0.287 | 0.000 | 0.000 | ||
| 3 spectra, FTFLPK | 0.000 | 0.000 | 0.000 | 0.056 | 0.000 | 0.944 | 0.000 | 0.000 | ||
| 3 spectra, HIYLGLPIALR | 0.000 | 0.003 | 0.000 | 0.174 | 0.000 | 0.823 | 0.000 | 0.000 | ||
| 8 spectra, DFLTFMK | 0.000 | 0.000 | 0.015 | 0.176 | 0.000 | 0.809 | 0.000 | 0.000 | ||
| 4 spectra, SENSPLYIGILEMGK | 0.000 | 0.038 | 0.000 | 0.000 | 0.000 | 0.962 | 0.000 | 0.000 |
| Plot | Mito | Lyso or Perox | ER | Golgi | PM | Cytosol | Nucleus | ||||||
| Expt B |
8 peptides |
21 spectra |
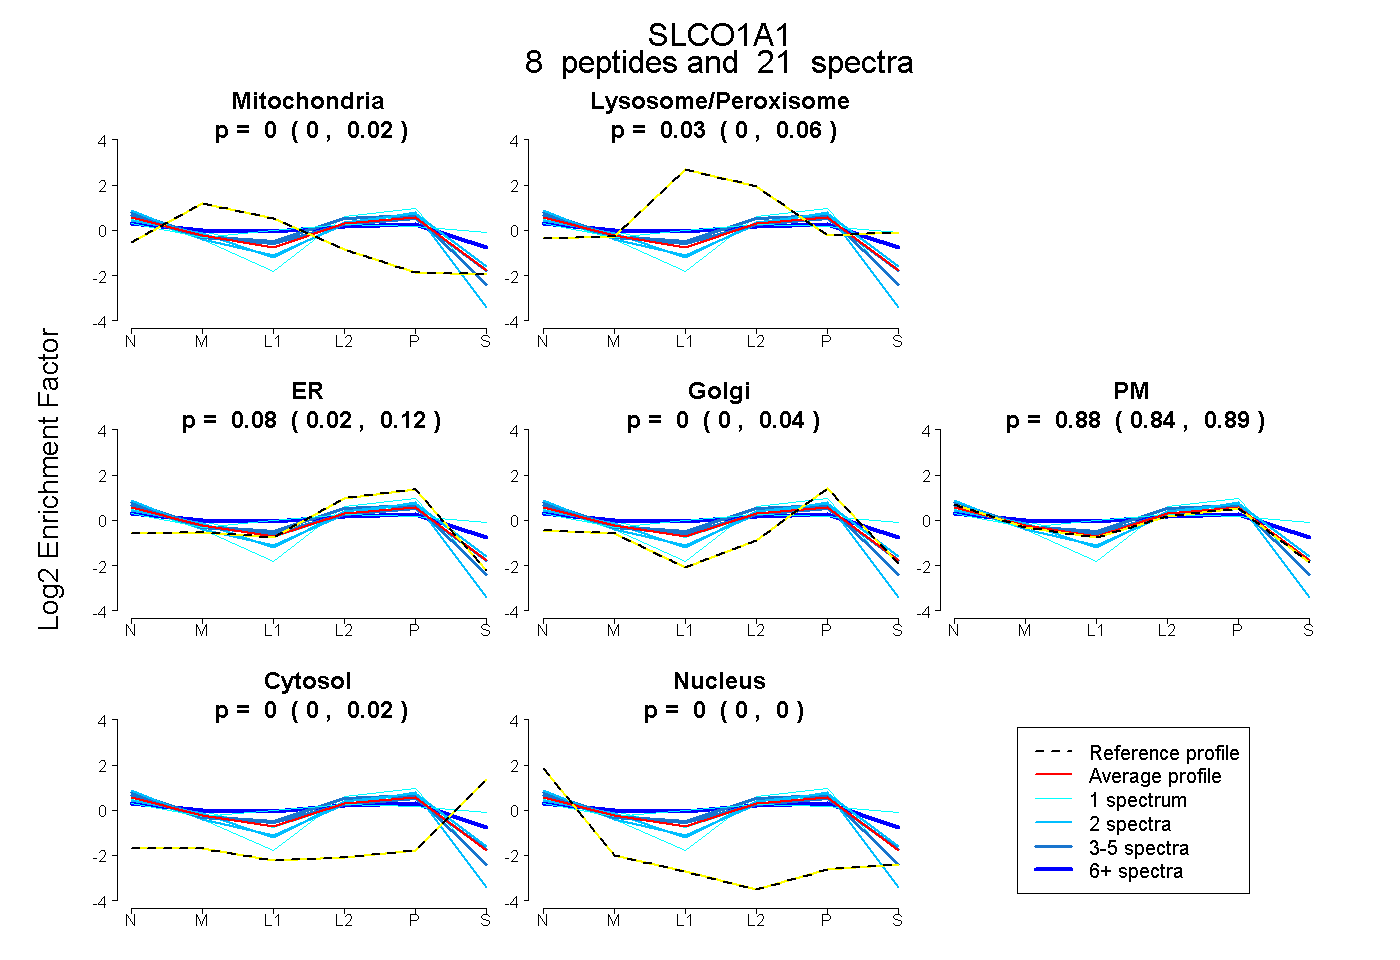 |
0.001 0.000 | 0.018 |
0.030 0.005 | 0.064 |
0.082 0.022 | 0.116 |
0.000 0.000 | 0.045 |
0.882 0.837 | 0.894 |
0.004 0.000 | 0.016 |
0.000 0.000 | 0.000 |
|||
| Plot | Lyso | Other | |||||||||||
| Expt C |
14 peptides |
84 spectra |
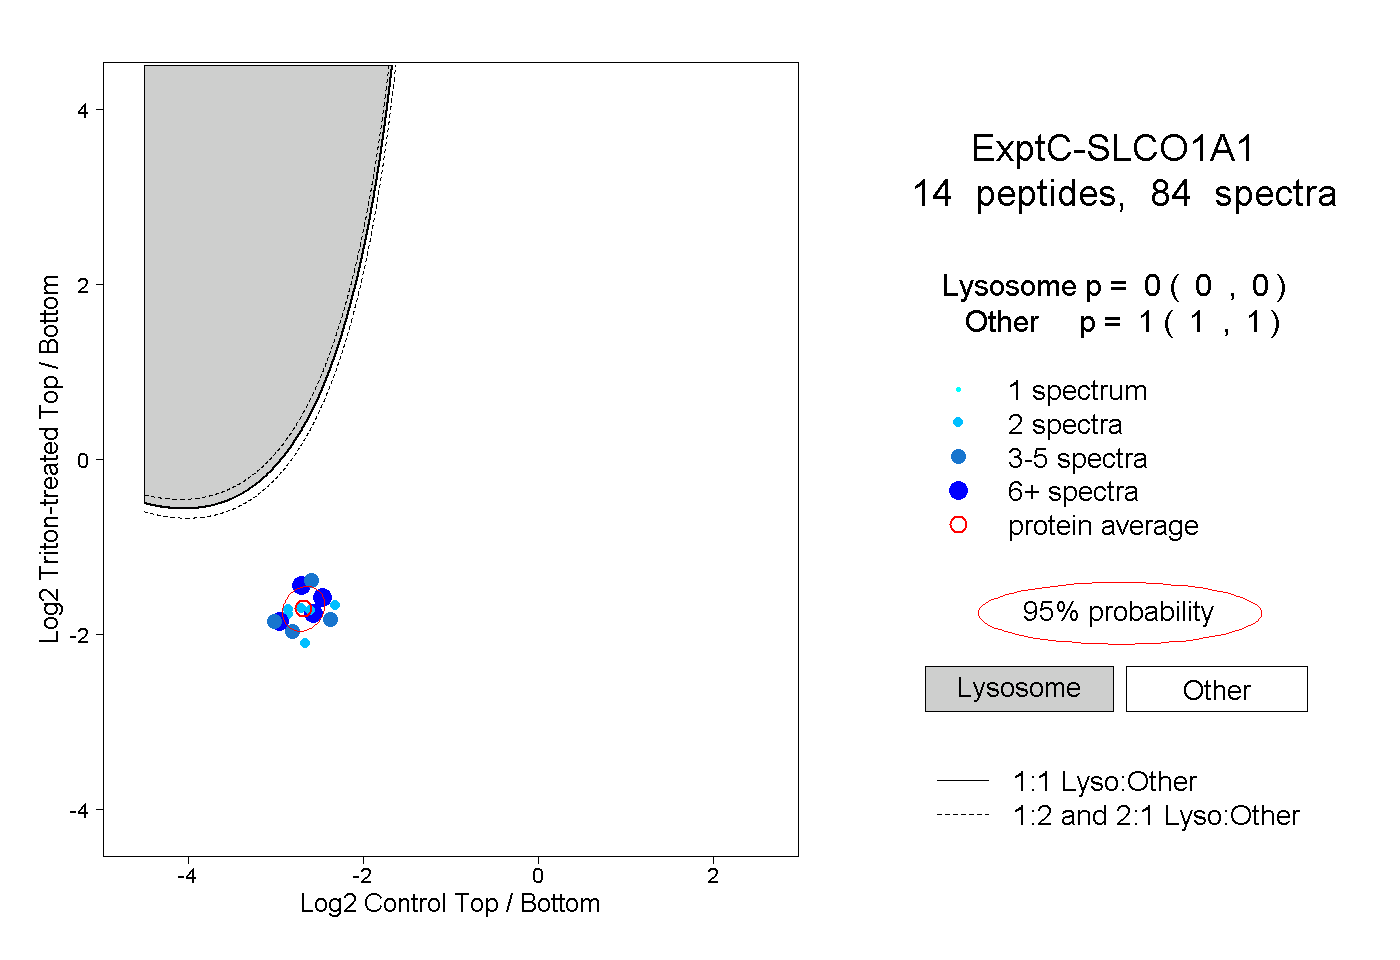 |
0.000 0.000 | 0.000 |
1.000 1.000 | 1.000 |
||||||||
| Plot | Lyso | Other | |||||||||||
| Expt D |
4 peptides |
6 spectra |
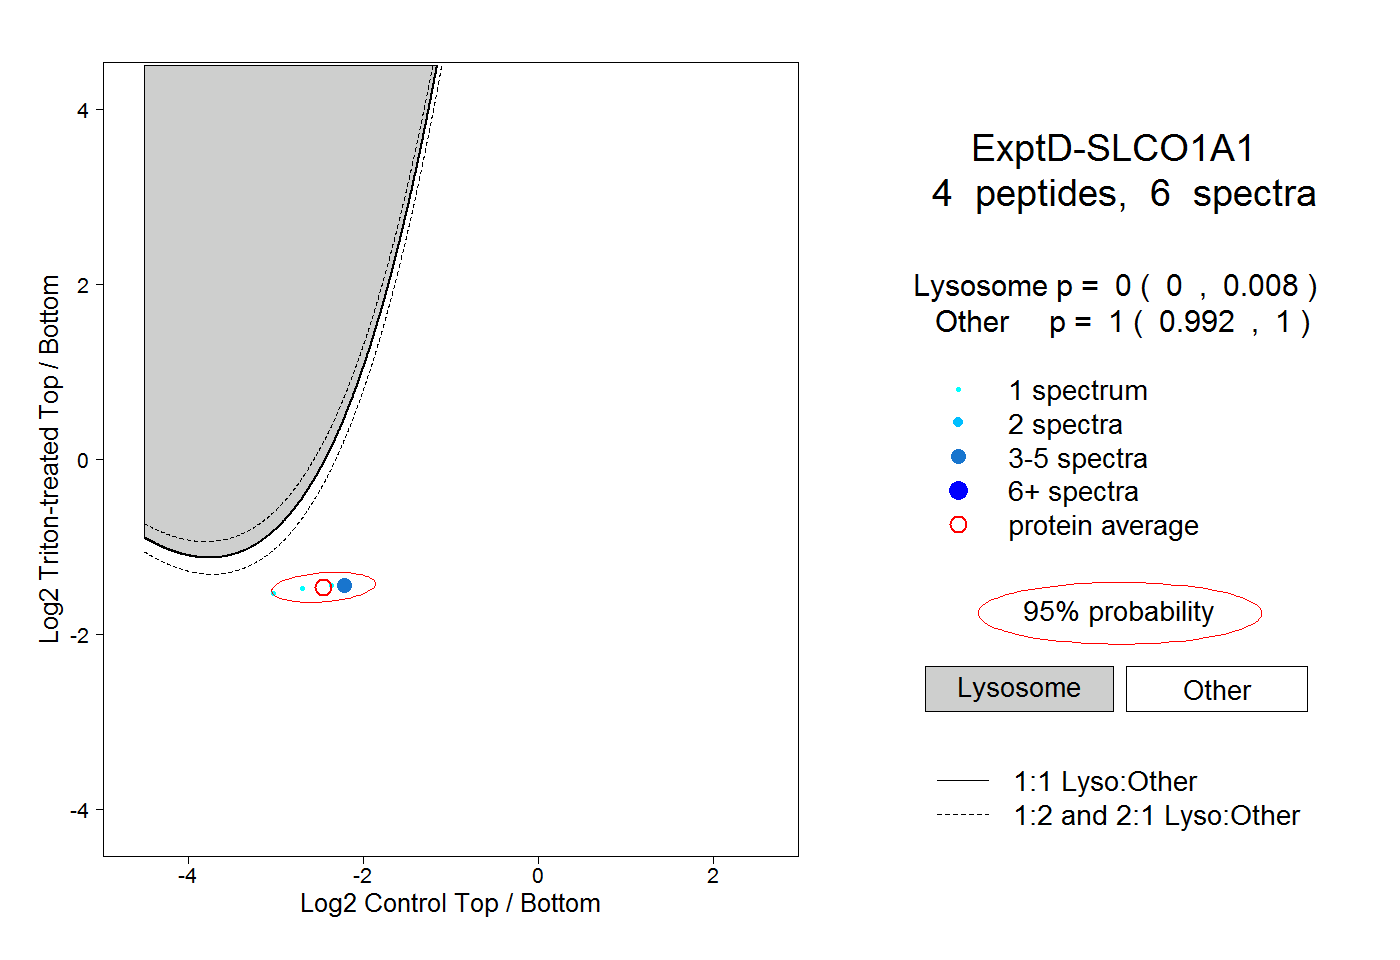 |
0.000 0.000 | 0.008 |
1.000 0.992 | 1.000 |