 1
1peptide
spectra
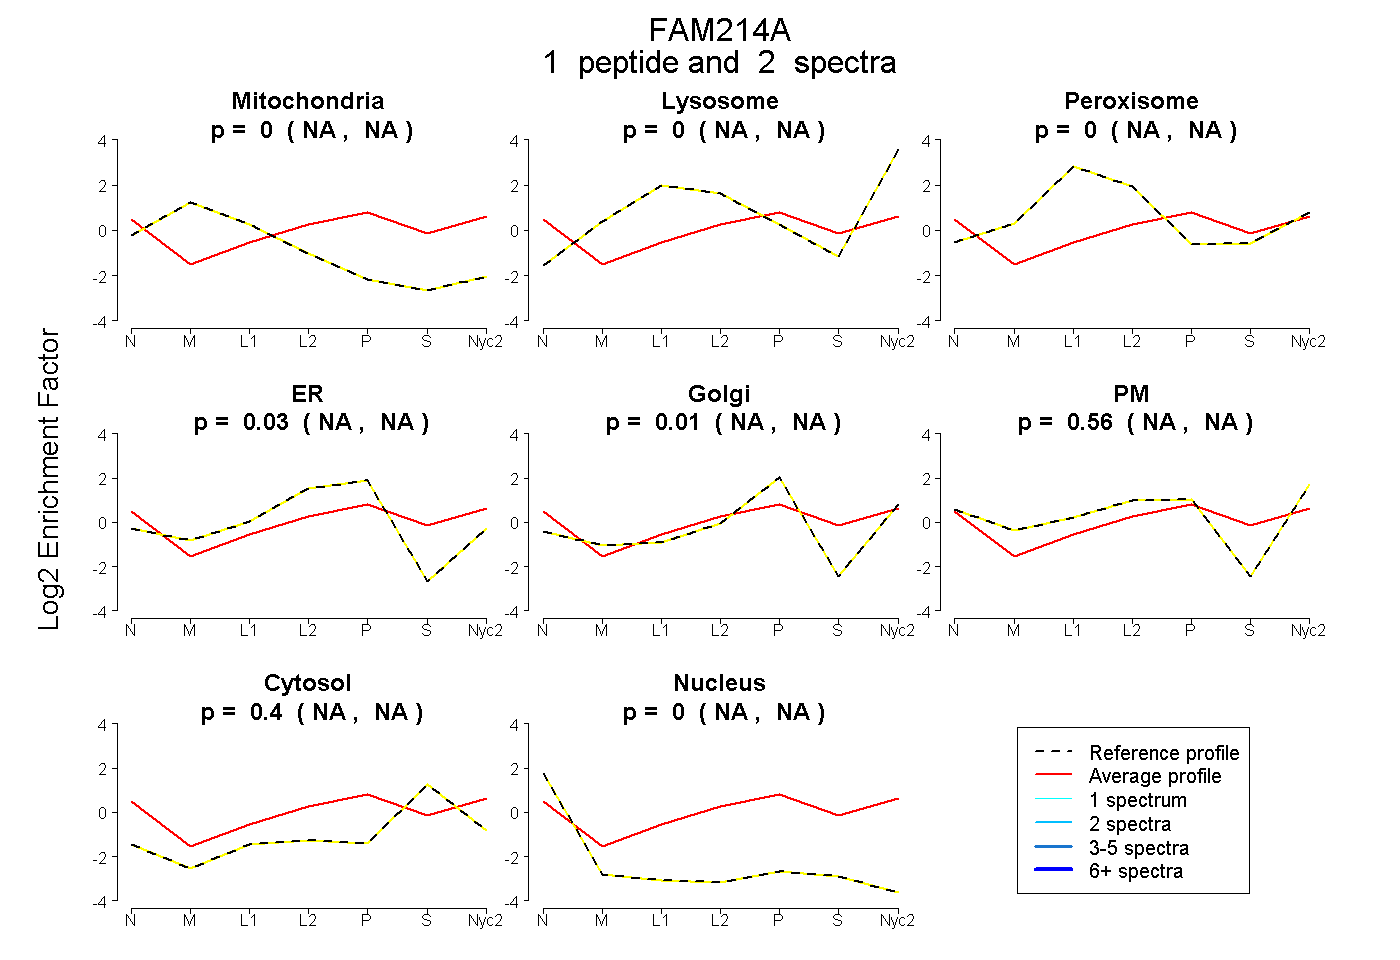
NA | NA
NA | NA
NA | NA
NA | NA
NA | NA
NA | NA
NA | NA
NA | NA
2peptides
spectra

0.000 | 0.000
0.624 | 0.819
0.000 | 0.092
0.000 | 0.029
0.000 | 0.000
0.155 | 0.311
0.000 | 0.000
1peptide
spectrum
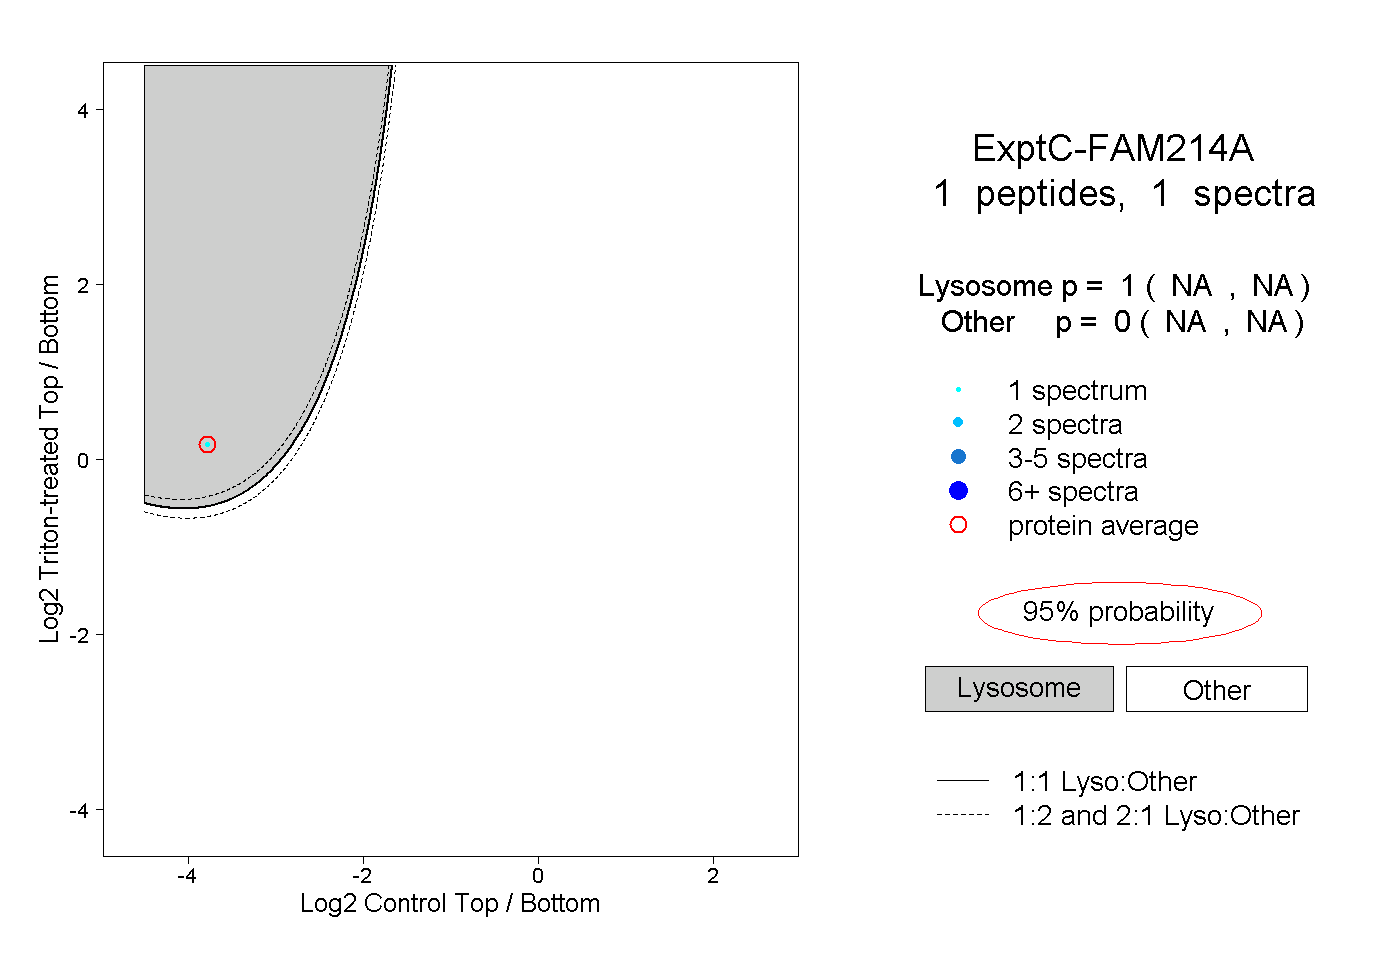
NA | NA
NA | NA