 1
1peptide
spectra
NA | NA
NA | NA
NA | NA
NA | NA
NA | NA
NA | NA
NA | NA
NA | NA
2peptides
spectra

0.000 | 0.000
0.624 | 0.819
0.000 | 0.092
0.000 | 0.029
0.000 | 0.000
0.155 | 0.311
0.000 | 0.000
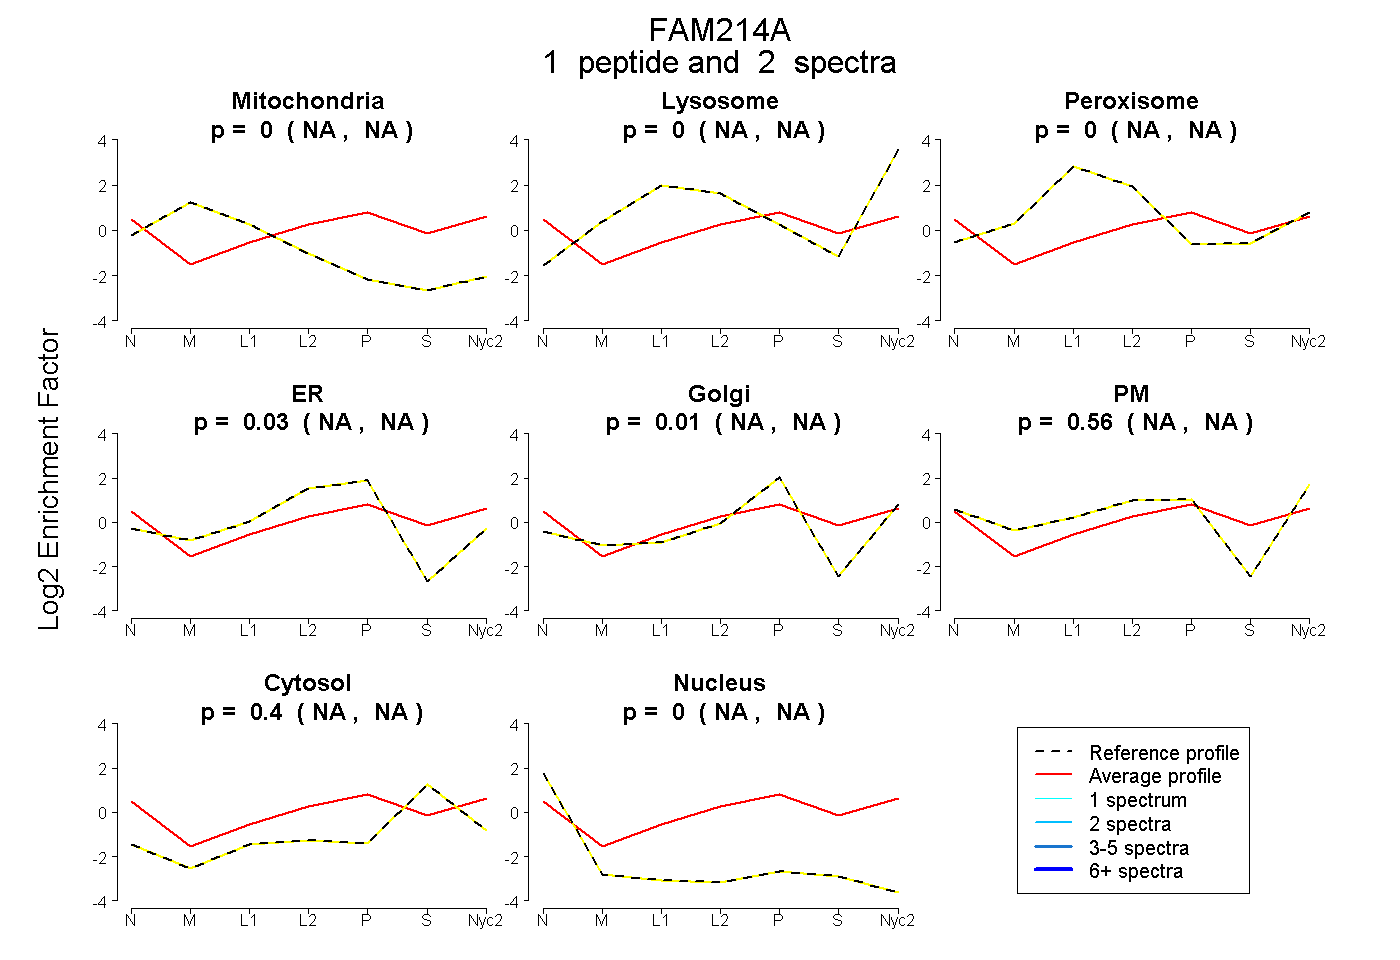
| Plot | Mito | Lyso | Perox | ER | Golgi | PM | Cytosol | Nucleus | |||||
| Expt A |
1 peptide |
2 spectra |
|
0.000 NA | NA |
0.000 NA | NA |
0.000 NA | NA |
0.026 NA | NA |
0.011 NA | NA |
0.558 NA | NA |
0.405 NA | NA |
0.000 NA | NA |
||
| Plot | Mito | Lyso or Perox | ER | Golgi | PM | Cytosol | Nucleus | ||||||
| Expt B |
2 peptides |
3 spectra |
|
0.000 0.000 | 0.000 |
0.751 0.624 | 0.819 |
0.000 0.000 | 0.092 |
0.000 0.000 | 0.029 |
0.000 0.000 | 0.000 |
0.249 0.155 | 0.311 |
0.000 0.000 | 0.000 |
| 2 spectra, FPGAAR | 0.000 | 0.839 | 0.000 | 0.000 | 0.000 | 0.161 | 0.000 | |||
| 1 spectrum, YLIHLR | 0.000 | 0.363 | 0.308 | 0.012 | 0.000 | 0.317 | 0.000 |
| Plot | Lyso | Other | |||||||||||
| Expt C |
1 peptide |
1 spectrum |
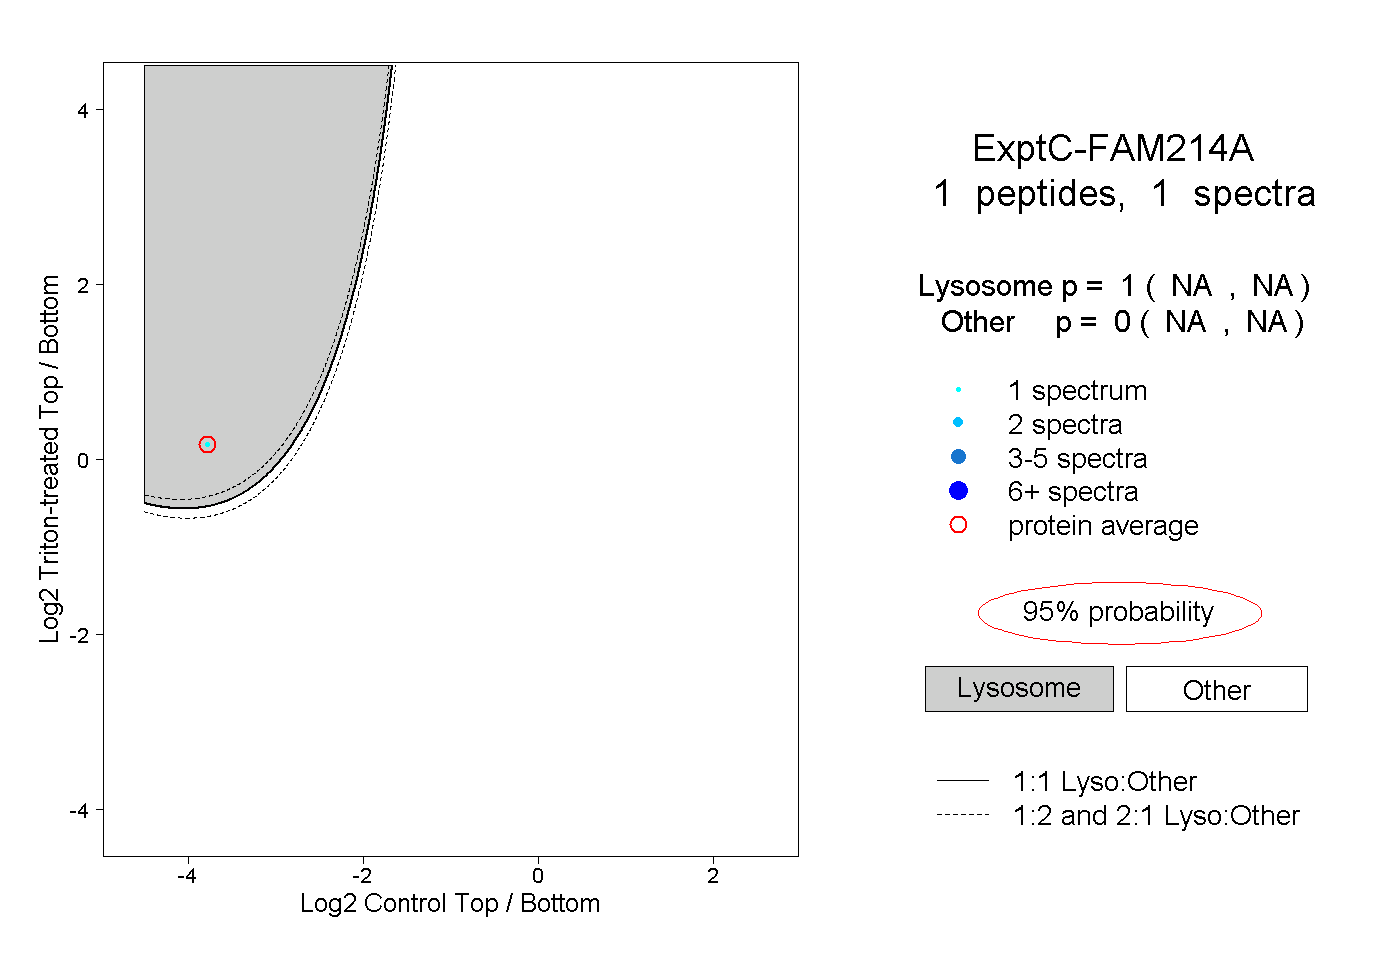 |
1.000 NA | NA |
0.000 NA | NA |