 18
18peptides
spectra
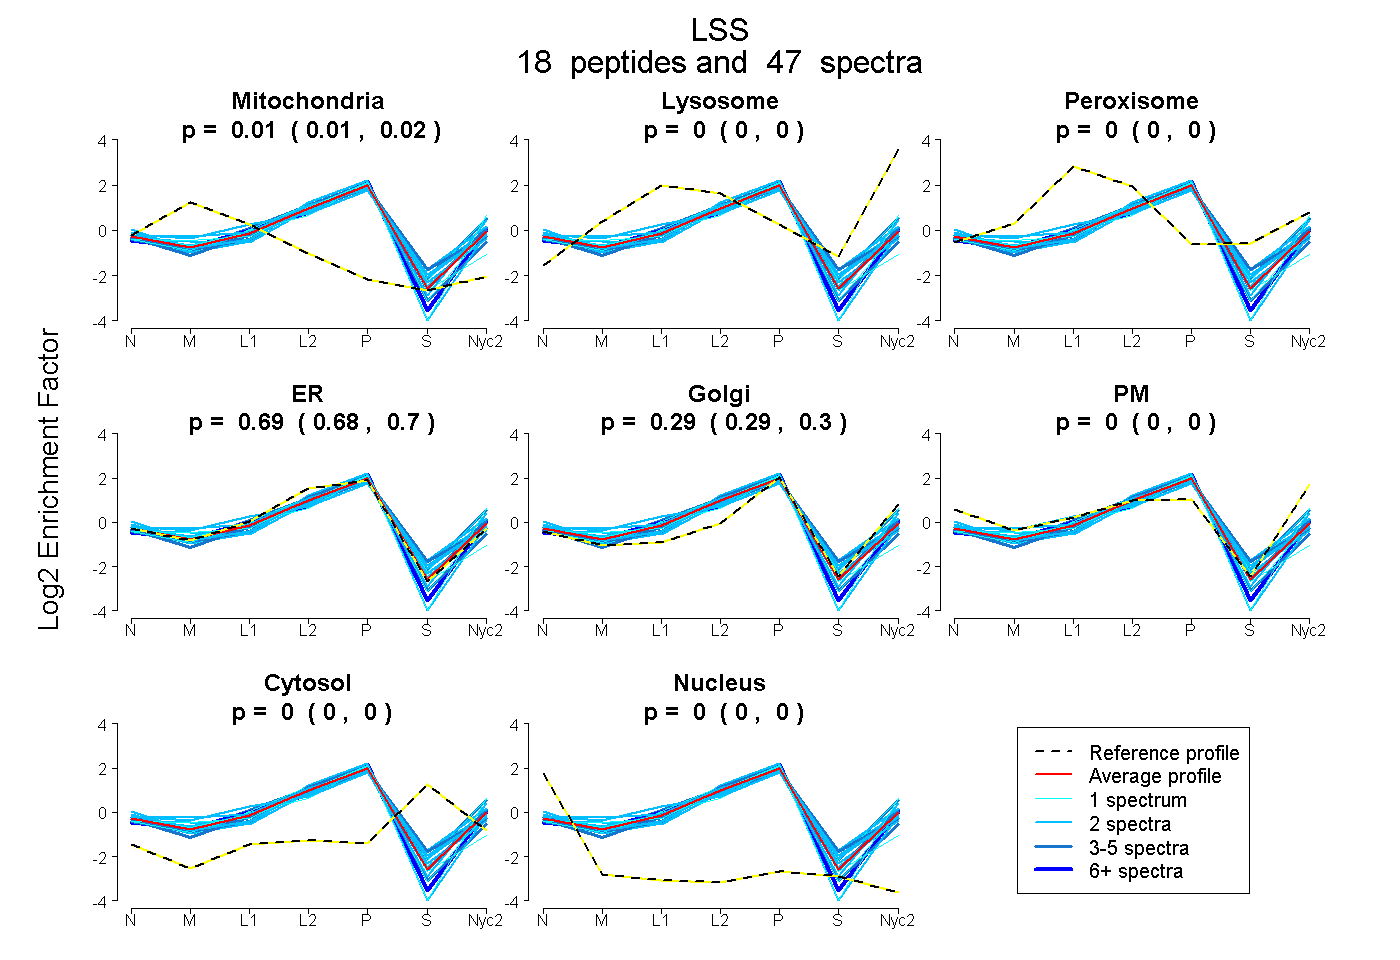
0.012 | 0.017
0.000 | 0.000
0.000 | 0.001
0.684 | 0.698
0.285 | 0.301
0.000 | 0.000
0.000 | 0.000
0.000 | 0.000
7peptides
spectra
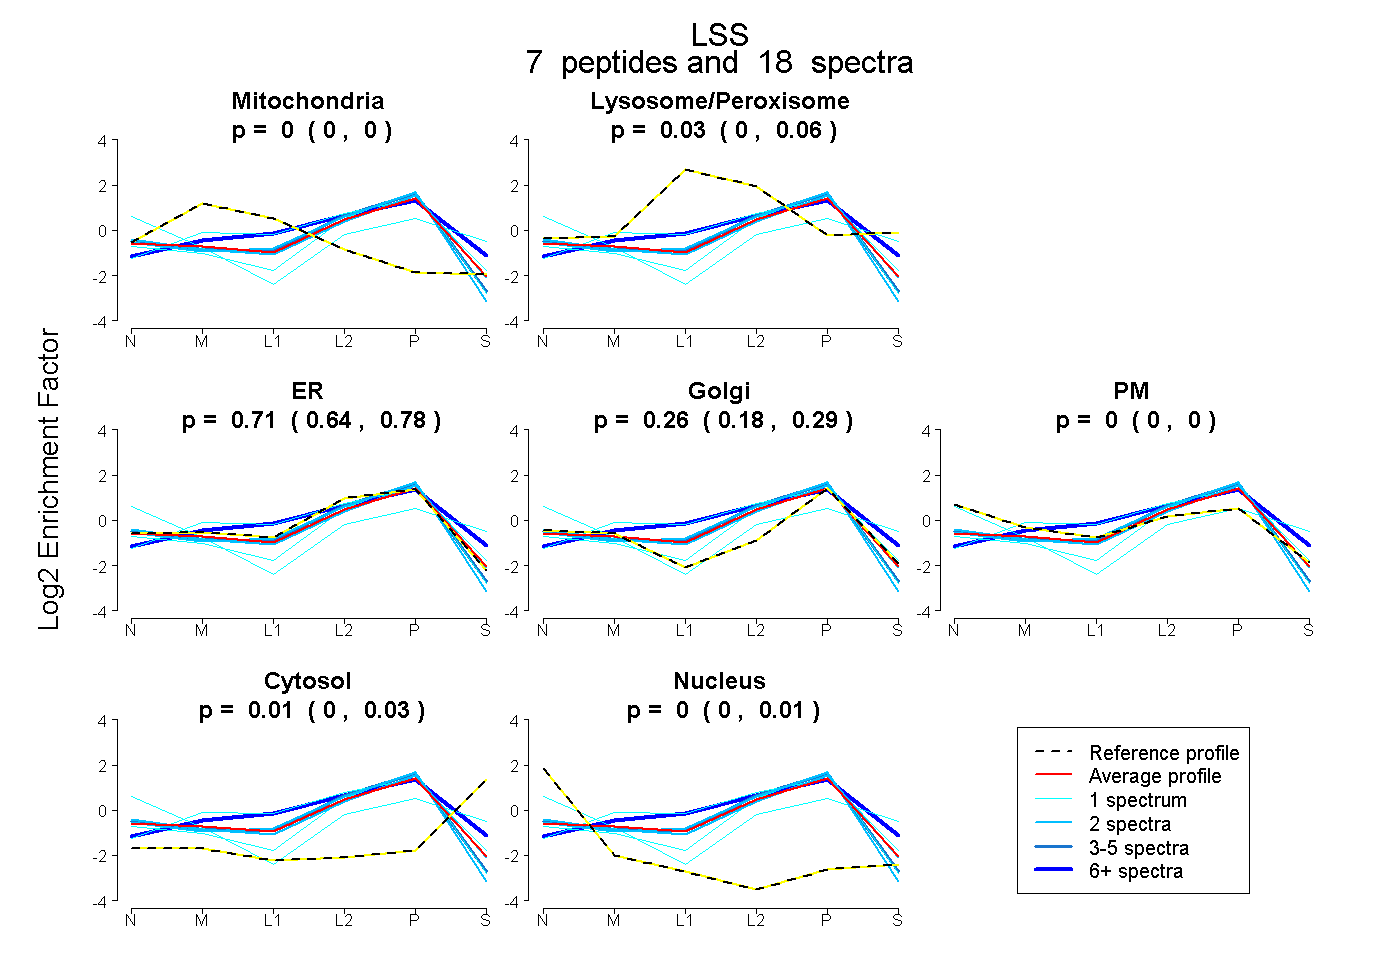
0.000 | 0.000
0.000 | 0.060
0.640 | 0.777
0.185 | 0.290
0.000 | 0.000
0.000 | 0.030
0.000 | 0.009
21peptides
spectra
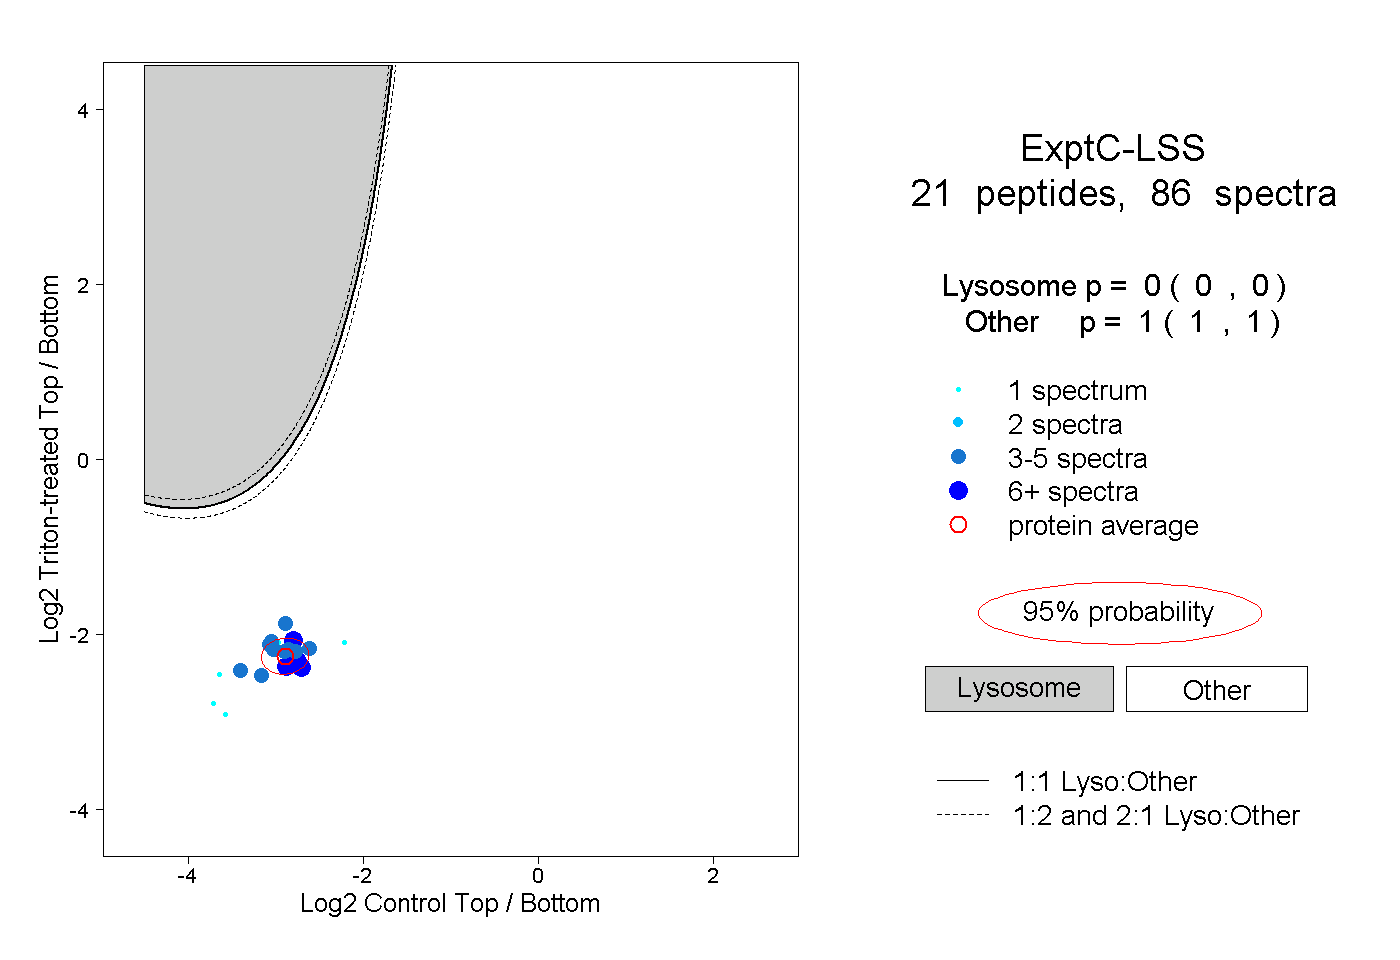
0.000 | 0.000
1.000 | 1.000
3peptides
spectra
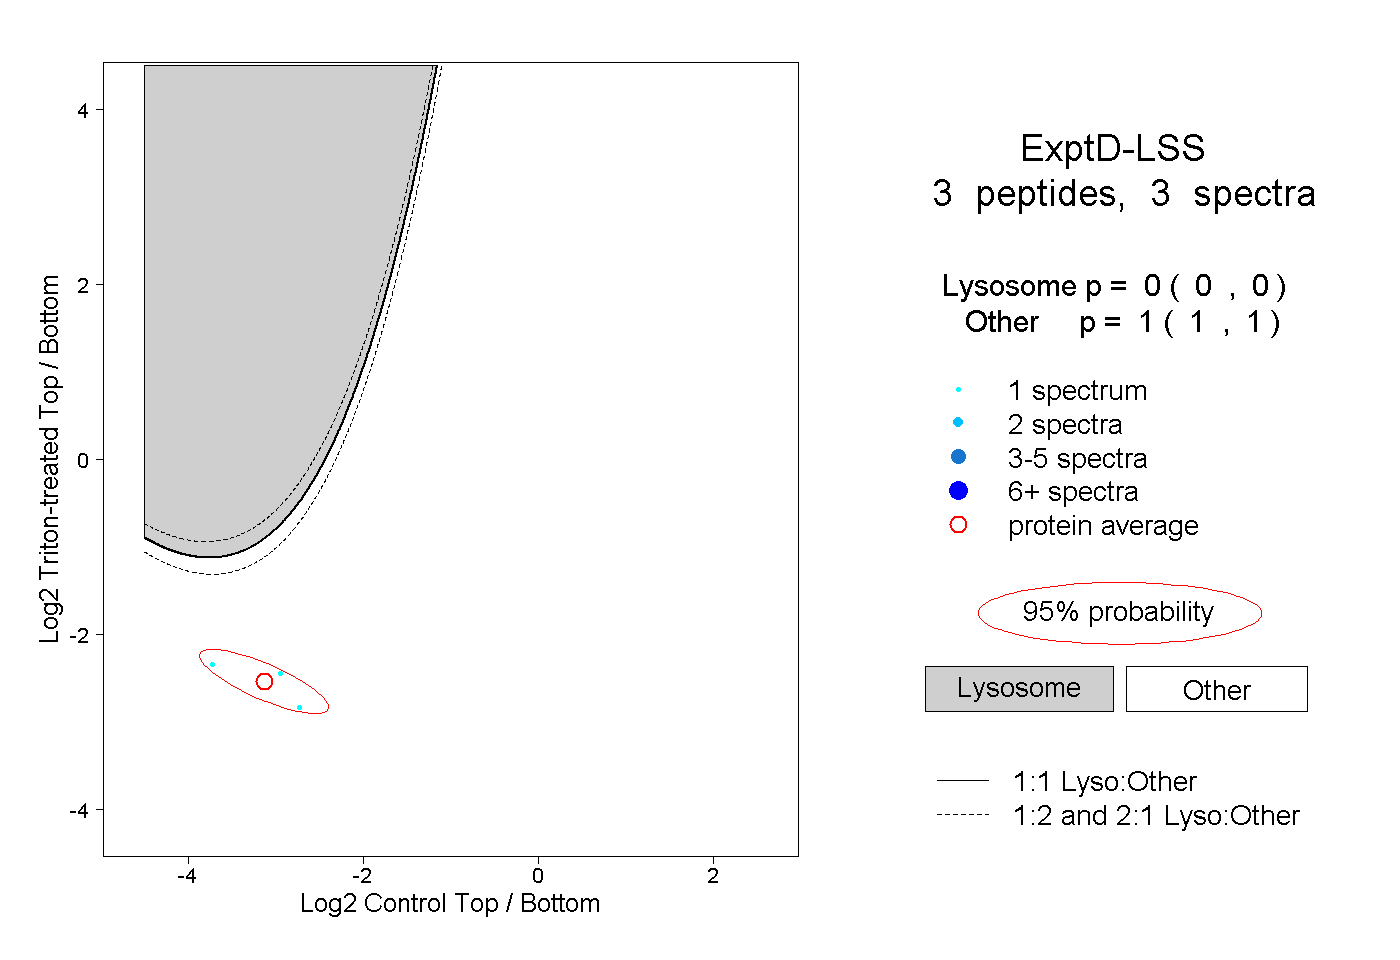
0.000 | 0.000
1.000 | 1.000