 7
7peptides
spectra
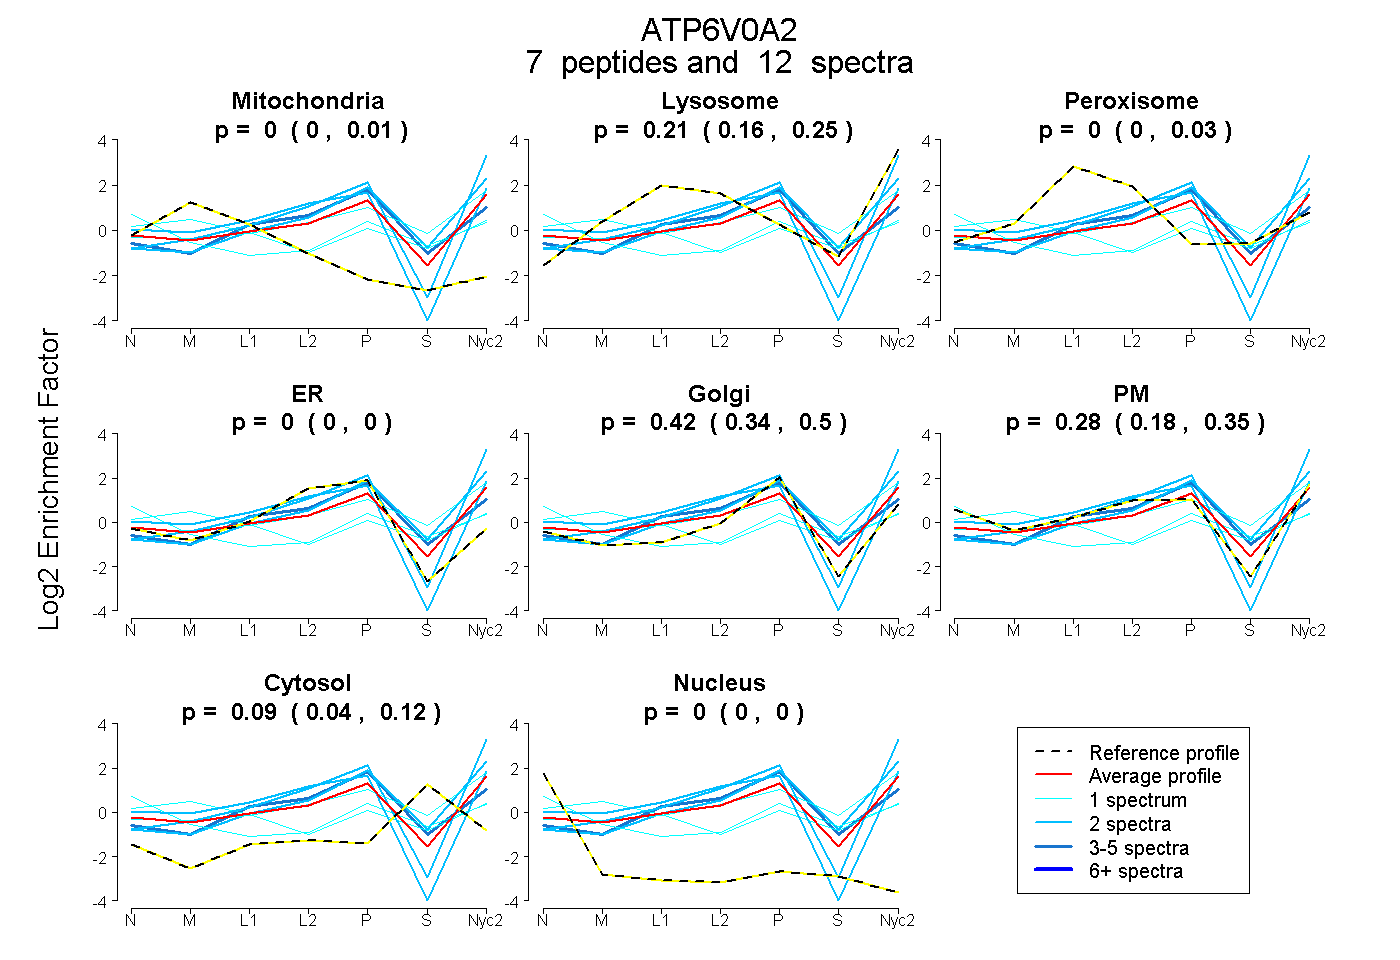
0.000 | 0.008
0.155 | 0.247
0.000 | 0.034
0.000 | 0.000
0.336 | 0.505
0.182 | 0.351
0.039 | 0.120
0.000 | 0.000
3peptides
spectra
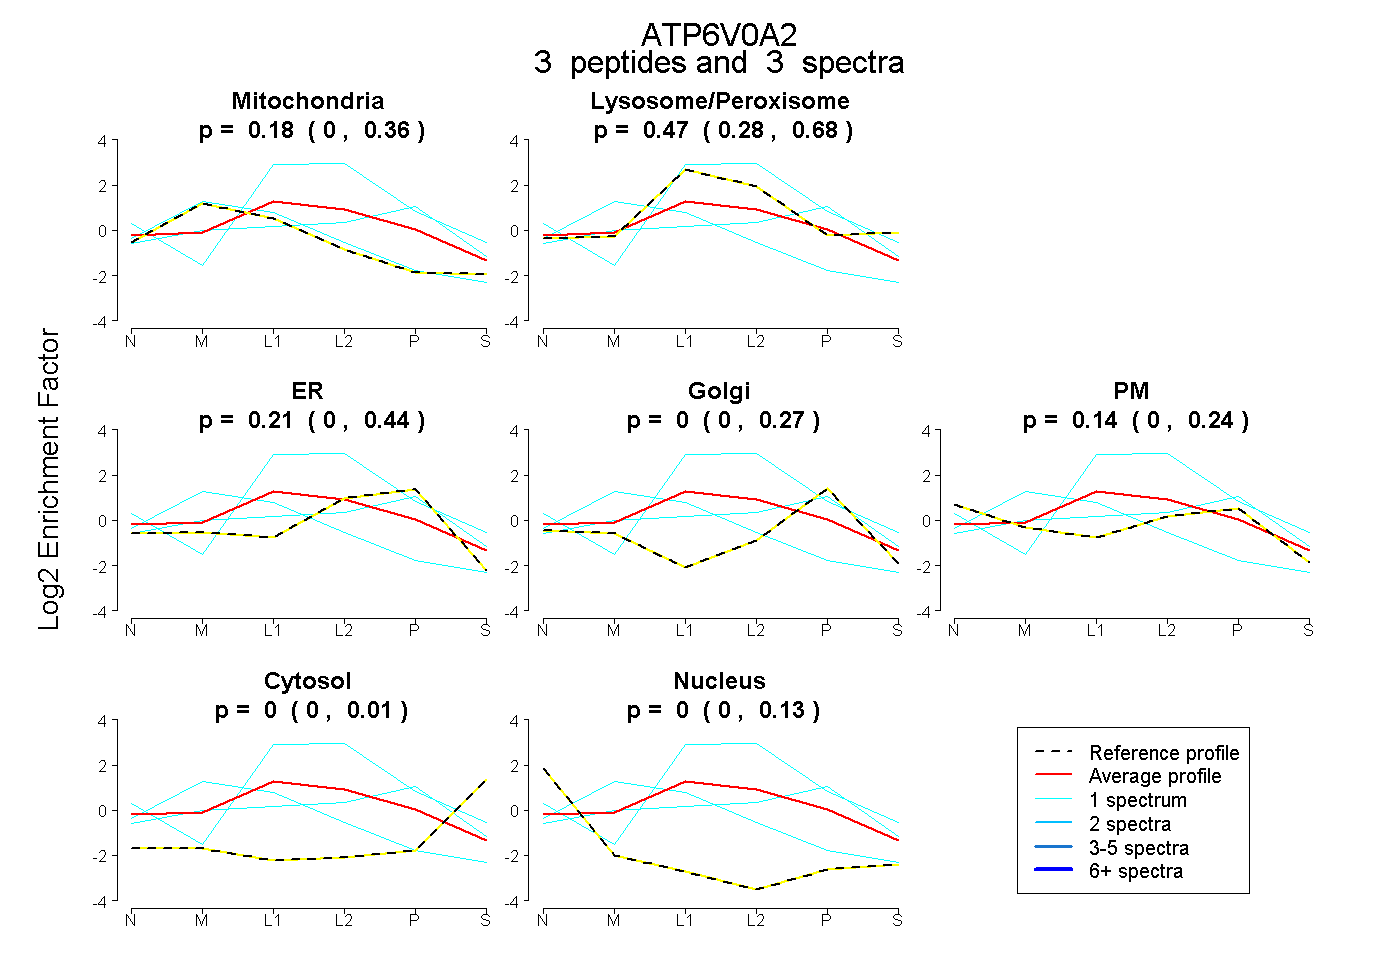
0.000 | 0.361
0.284 | 0.684
0.000 | 0.442
0.000 | 0.268
0.000 | 0.237
0.000 | 0.011
0.000 | 0.132
11peptides
spectra
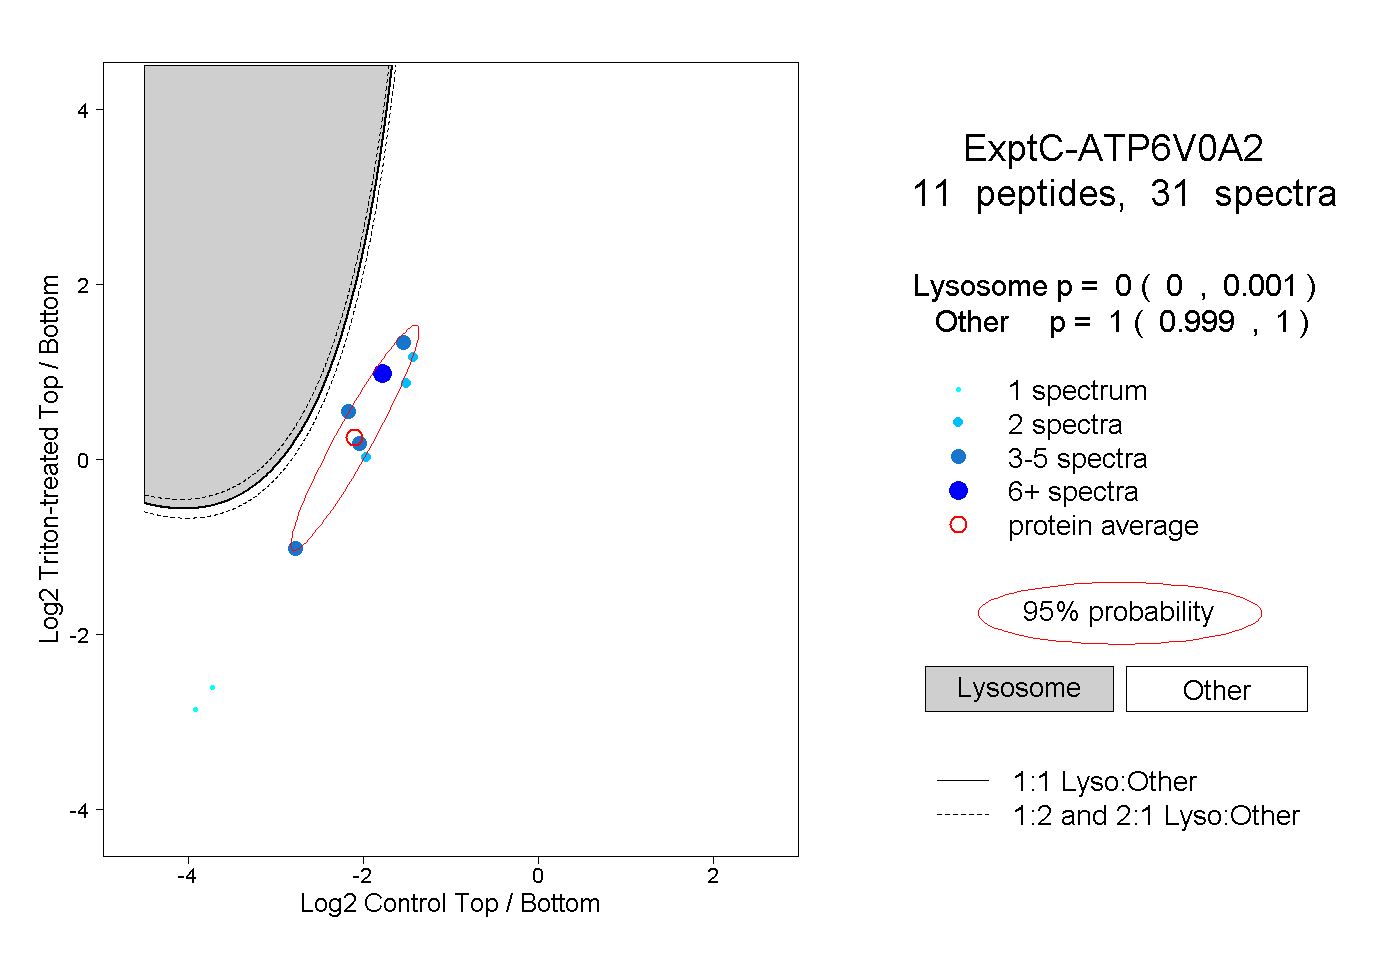
0.000 | 0.001
0.999 | 1.000
1peptide
spectra
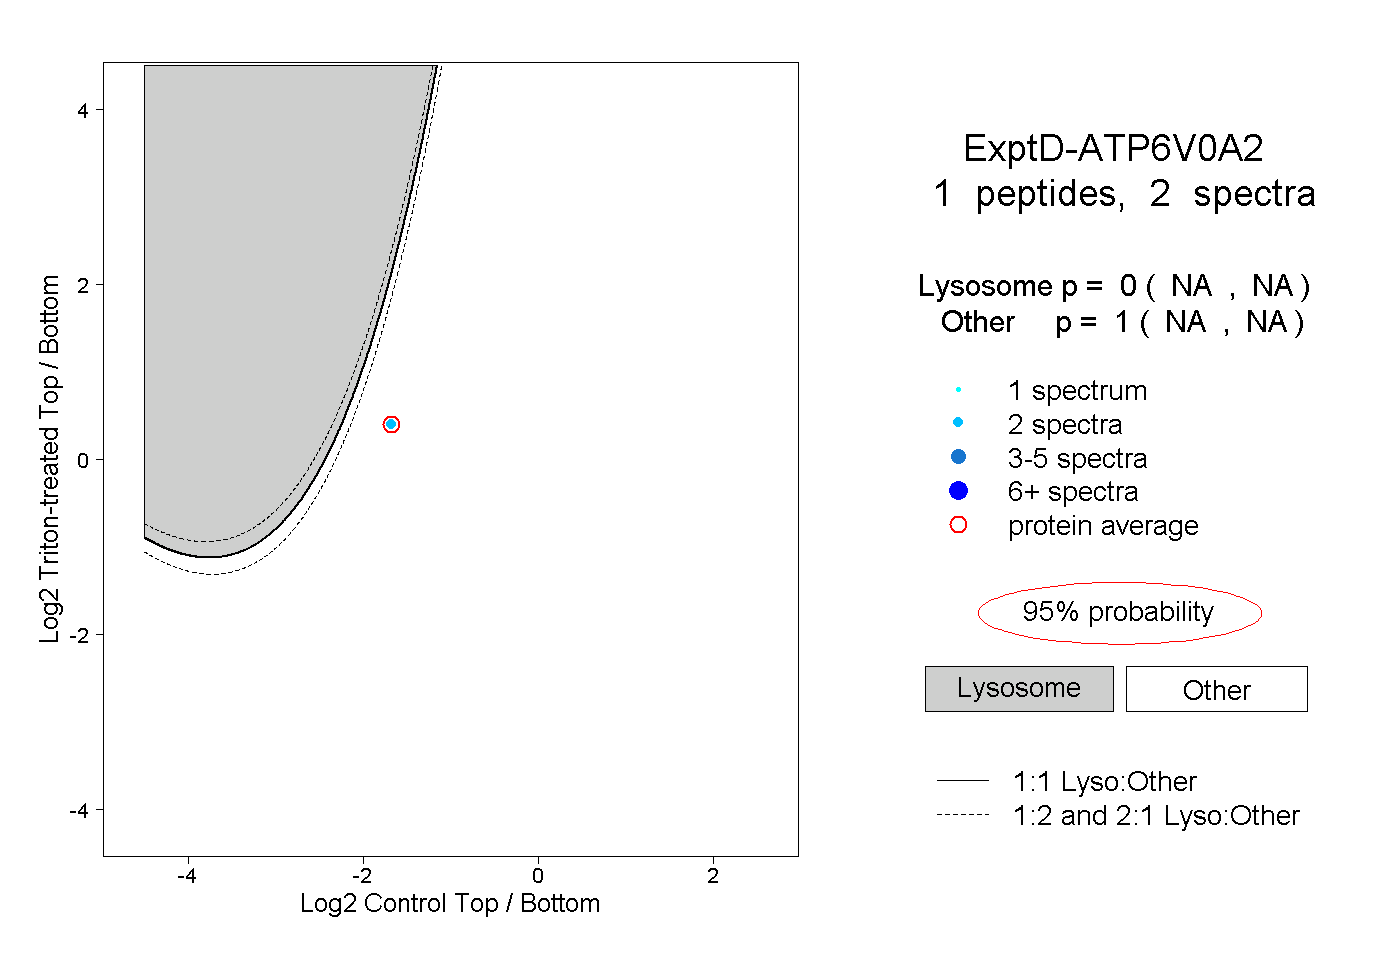
NA | NA
NA | NA