 7
7peptides
spectra
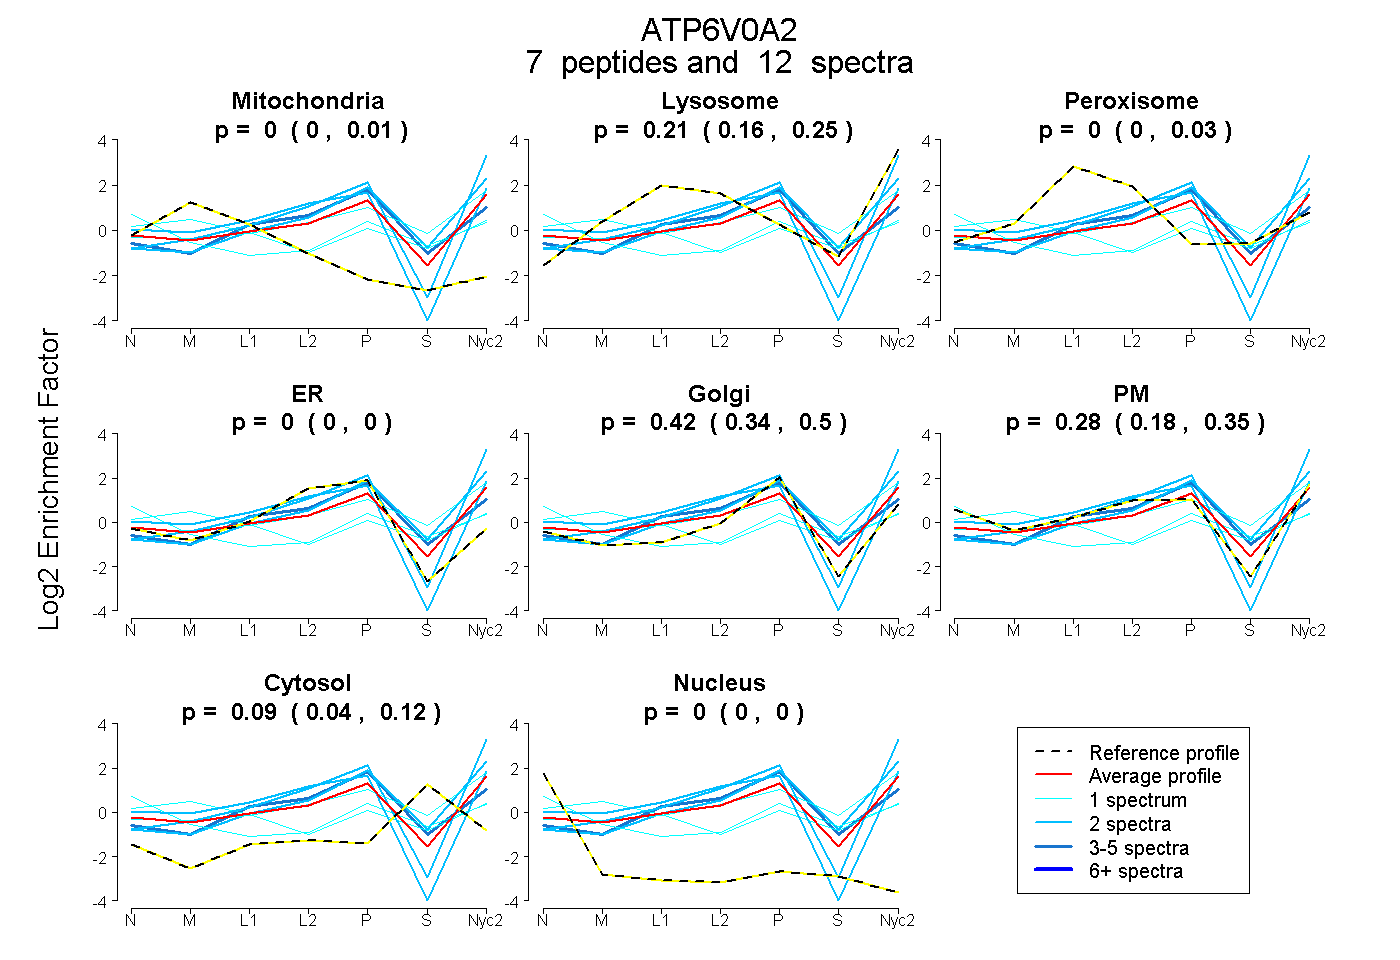
0.000 | 0.008
0.155 | 0.247
0.000 | 0.034
0.000 | 0.000
0.336 | 0.505
0.182 | 0.351
0.039 | 0.120
0.000 | 0.000
| Plot | Mito | Lyso | Perox | ER | Golgi | PM | Cytosol | Nucleus | |||||
| Expt A |
7 peptides |
12 spectra |
|
0.000 0.000 | 0.008 |
0.209 0.155 | 0.247 |
0.000 0.000 | 0.034 |
0.000 0.000 | 0.000 |
0.422 0.336 | 0.505 |
0.284 0.182 | 0.351 |
0.085 0.039 | 0.120 |
0.000 0.000 | 0.000 |
| 1 spectrum, TEDYLR | 0.000 | 0.324 | 0.000 | 0.000 | 0.202 | 0.222 | 0.252 | 0.000 | ||
| 2 spectra, TLQLDPNIPGVFR | 0.000 | 0.405 | 0.000 | 0.000 | 0.406 | 0.189 | 0.000 | 0.000 | ||
| 2 spectra, NLLELVEYTHMLR | 0.000 | 0.013 | 0.000 | 0.161 | 0.000 | 0.826 | 0.000 | 0.000 | ||
| 2 spectra, ETPPTLIR | 0.000 | 0.383 | 0.000 | 0.000 | 0.536 | 0.000 | 0.081 | 0.000 | ||
| 1 spectrum, HVLEMQEQLQK | 0.011 | 0.000 | 0.000 | 0.000 | 0.118 | 0.462 | 0.304 | 0.105 | ||
| 1 spectrum, ADIPLPEGEASPPAPPVK | 0.291 | 0.100 | 0.000 | 0.000 | 0.112 | 0.280 | 0.218 | 0.000 | ||
| 3 spectra, AAESVCSR | 0.000 | 0.188 | 0.081 | 0.156 | 0.471 | 0.000 | 0.104 | 0.000 |
| Plot | Mito | Lyso or Perox | ER | Golgi | PM | Cytosol | Nucleus | ||||||
| Expt B |
3 peptides |
3 spectra |
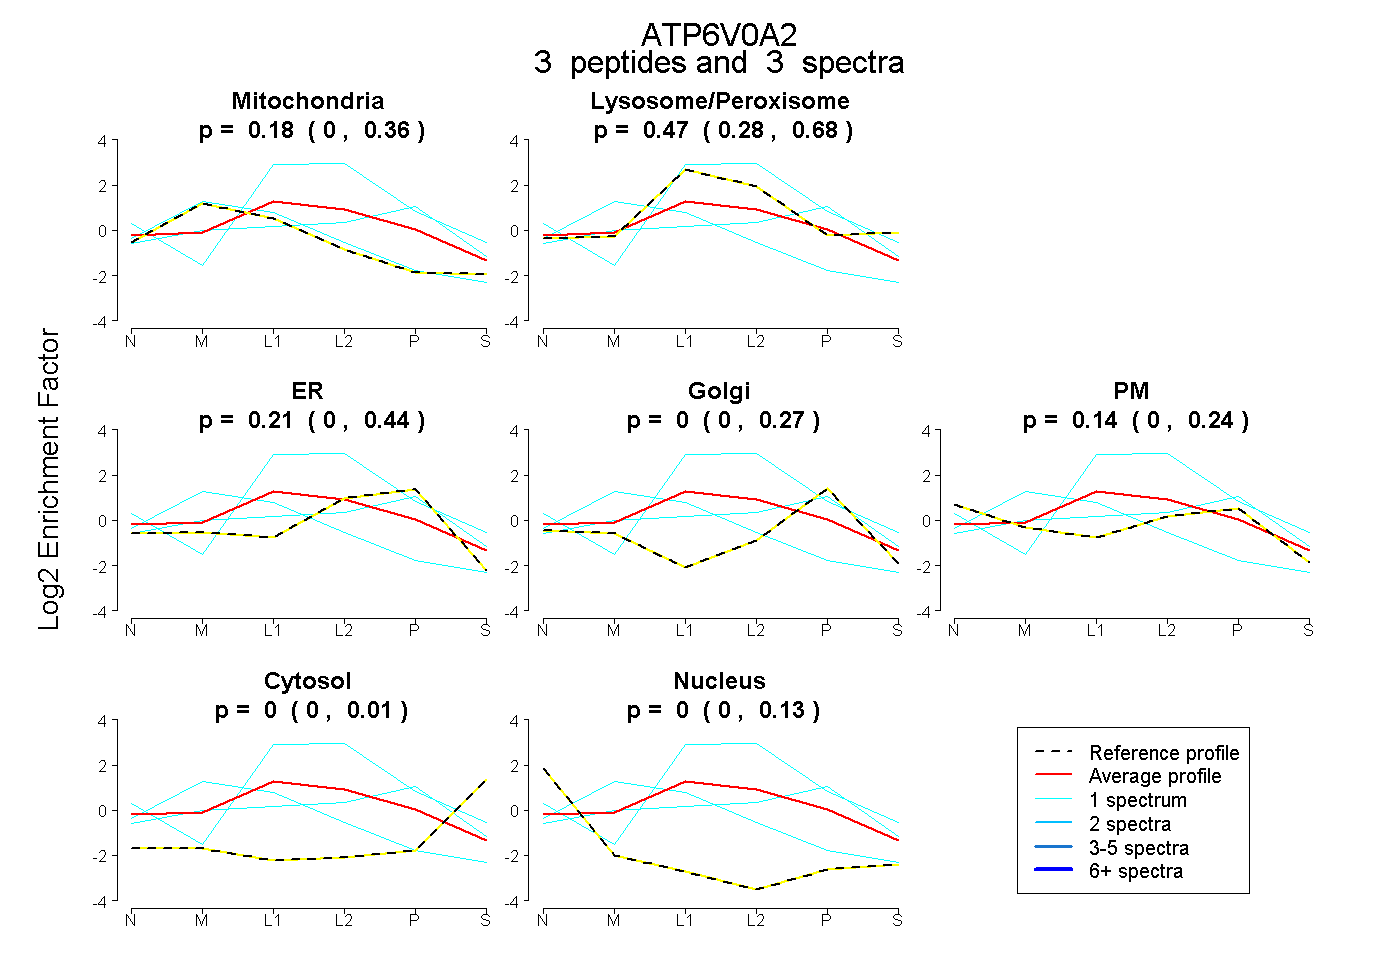 |
0.178 0.000 | 0.361 |
0.470 0.284 | 0.684 |
0.213 0.000 | 0.442 |
0.000 0.000 | 0.268 |
0.138 0.000 | 0.237 |
0.000 0.000 | 0.011 |
0.000 0.000 | 0.132 |
|||
| Plot | Lyso | Other | |||||||||||
| Expt C |
11 peptides |
31 spectra |
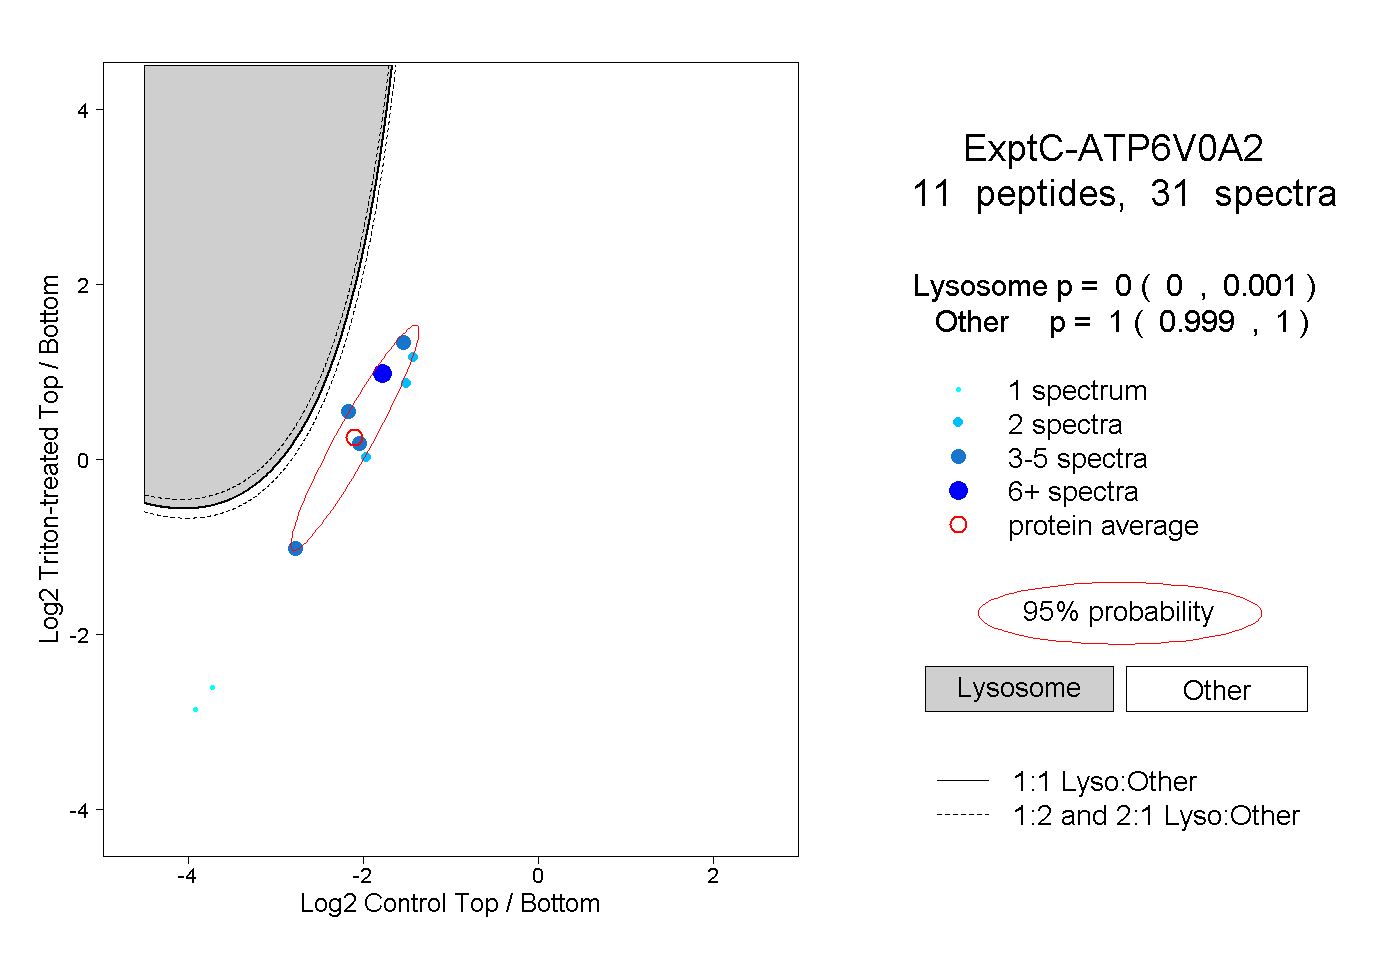 |
0.000 0.000 | 0.001 |
1.000 0.999 | 1.000 |
||||||||
| Plot | Lyso | Other | |||||||||||
| Expt D |
1 peptide |
2 spectra |
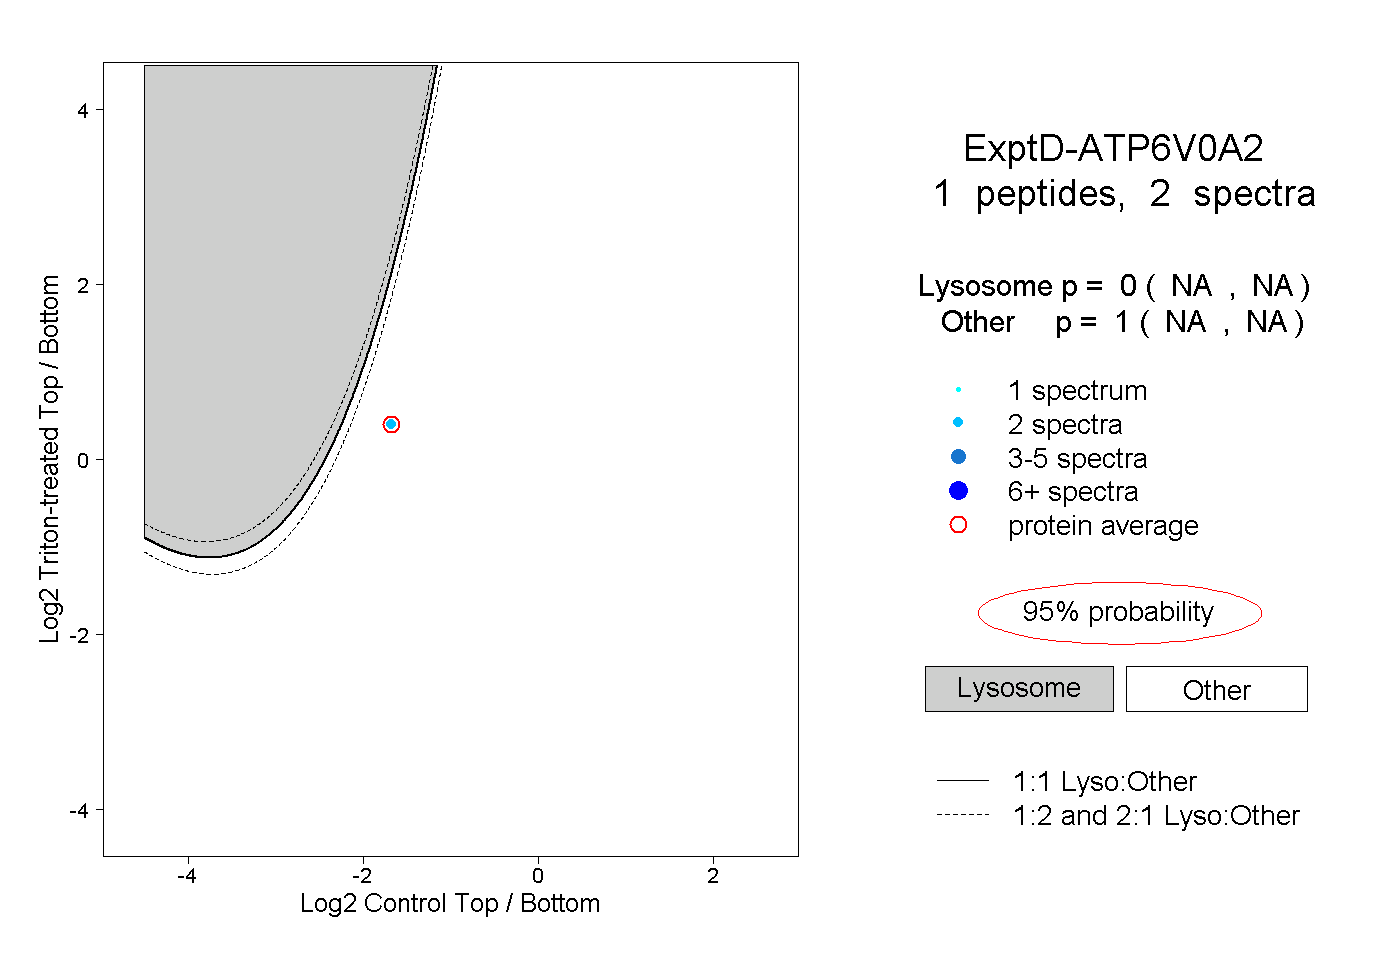 |
0.000 NA | NA |
1.000 NA | NA |